Google Chrome introduces a new Performance Insights panel
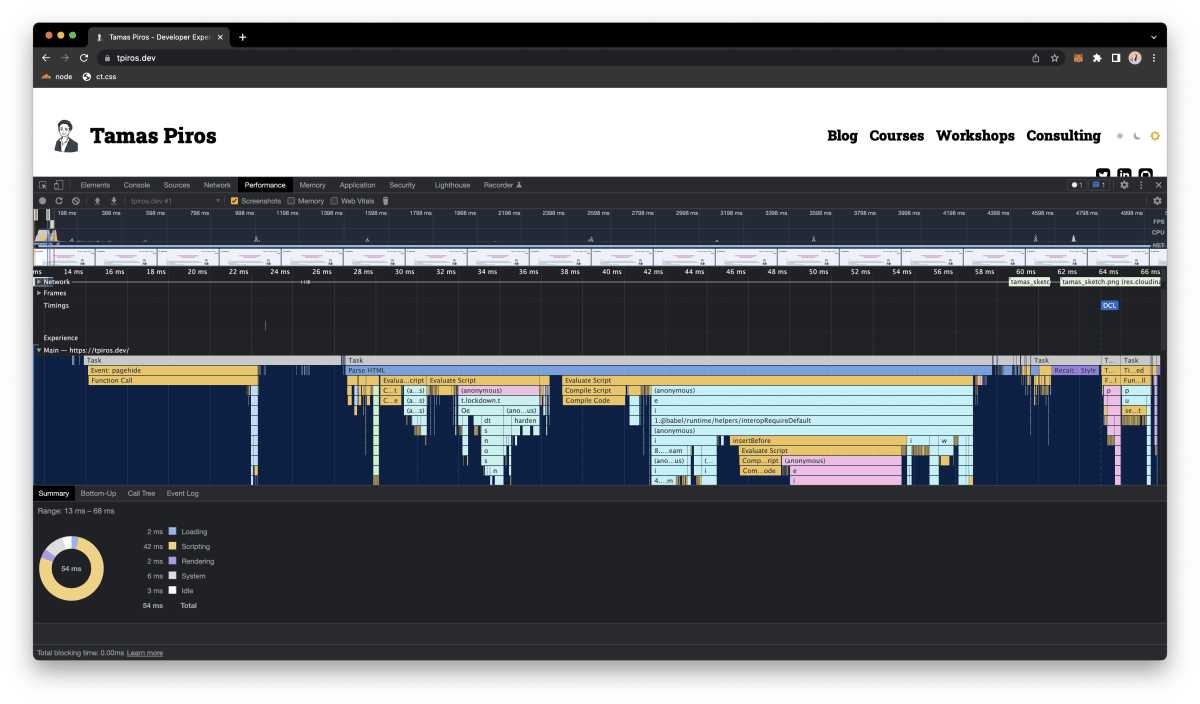
Having done quite a few Web Performance workshops in the past, and having done some performance monitoring of various sites, I used the Chrome Performance panel quite extensively. And yes, even today, it scares me. There's a lot going on within that panel. Just look at the screenshot below - even for a rather simple site such as the one you're browsing, there are a lot things to unpack.
Based on conversations that I had with other developers and based on feedback shared with Google as well, it was evident that the performance panel was difficult to use and requires a deep technical understanding of a lot of different components.
Performance Insights - a new panel
The Chrome team has listened and created a brand new panel added called Performance Insights - which is now part (as an experimental feature) of DevTools.
The new Performance Insights panel is use-case driven and presents developers with actionable insights. While the majority of the view isvery similar to the existing Performance panel, there are a bunch of new additions to it, such as the replay feature which can reply the entire request cycle with an option to pause and even manually drag and drop the timeline.
I personally also found the network requests to be more clear and straightfoward to understand compared to the same view of the classic Performance panel.
Core Web Vitals
There was also a lot of effort put into displaying information about the Core Web Vital metrics. Layout shifts are measured by the new Performance Insights panel as well and we can see the LCP (Largest Contentful Paint), along with the First Contentful Paint, Time To Interactive and DOM Content Loaded events.
Insights Panel
One of the most important additions is the Insights side panel. This is the place that contains actionable insights, with easy to fix solutions. I like to think of these as the same pointers we can see in Lighthouse.
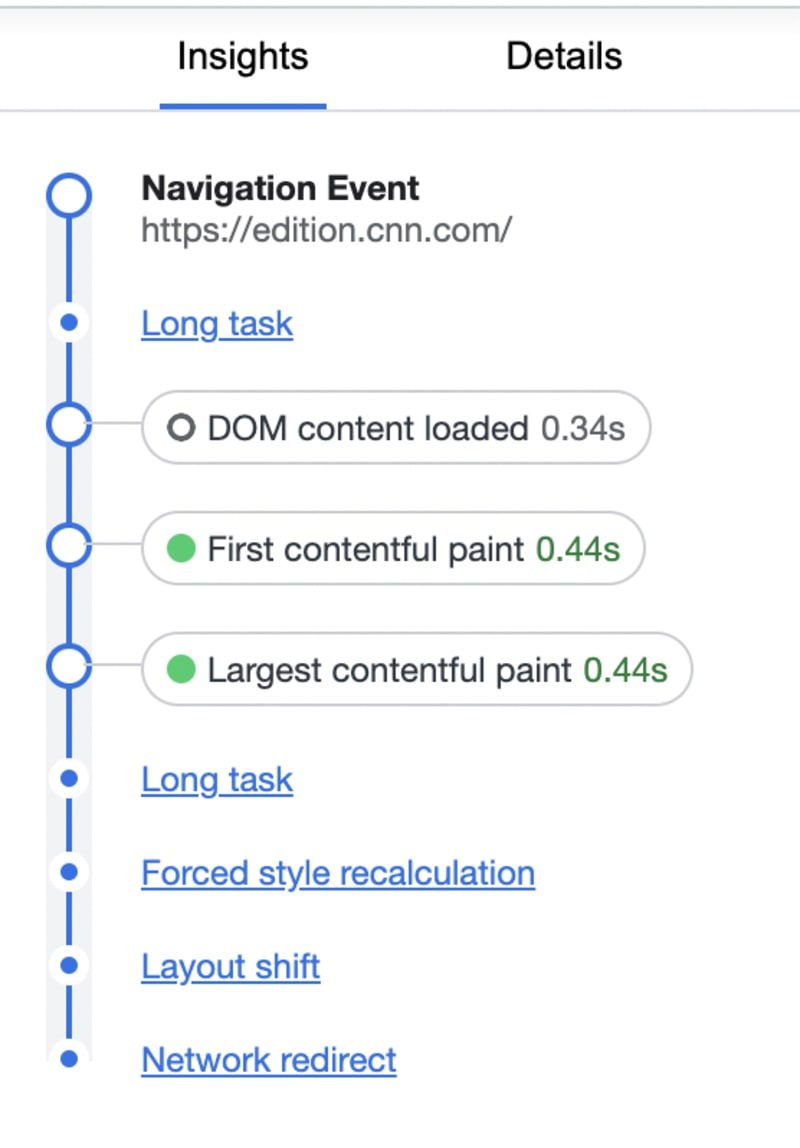
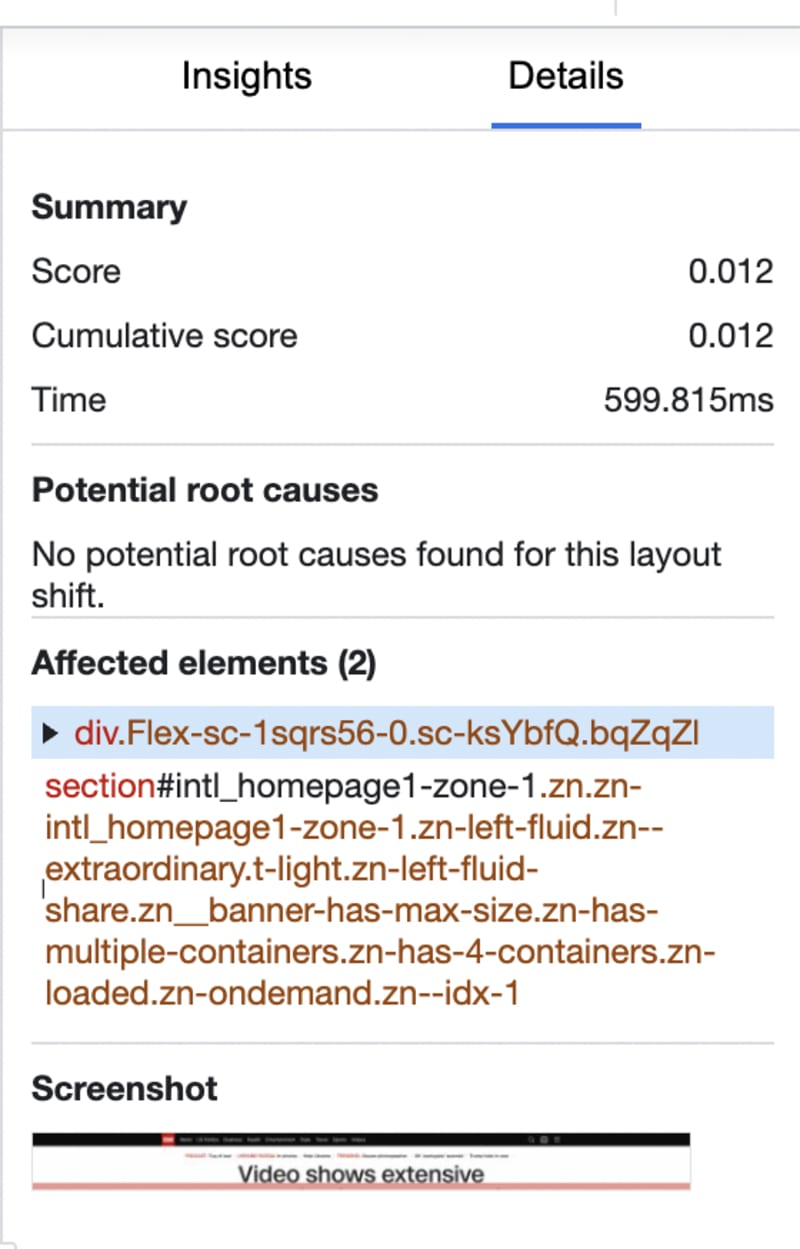
Clicking on the suggestions in the panel will bring up additional information about the issue, and if applicable, it will also highlight the element plus show us the exact time the event occured, moving along the timeline as well automatically.
Measure Page load
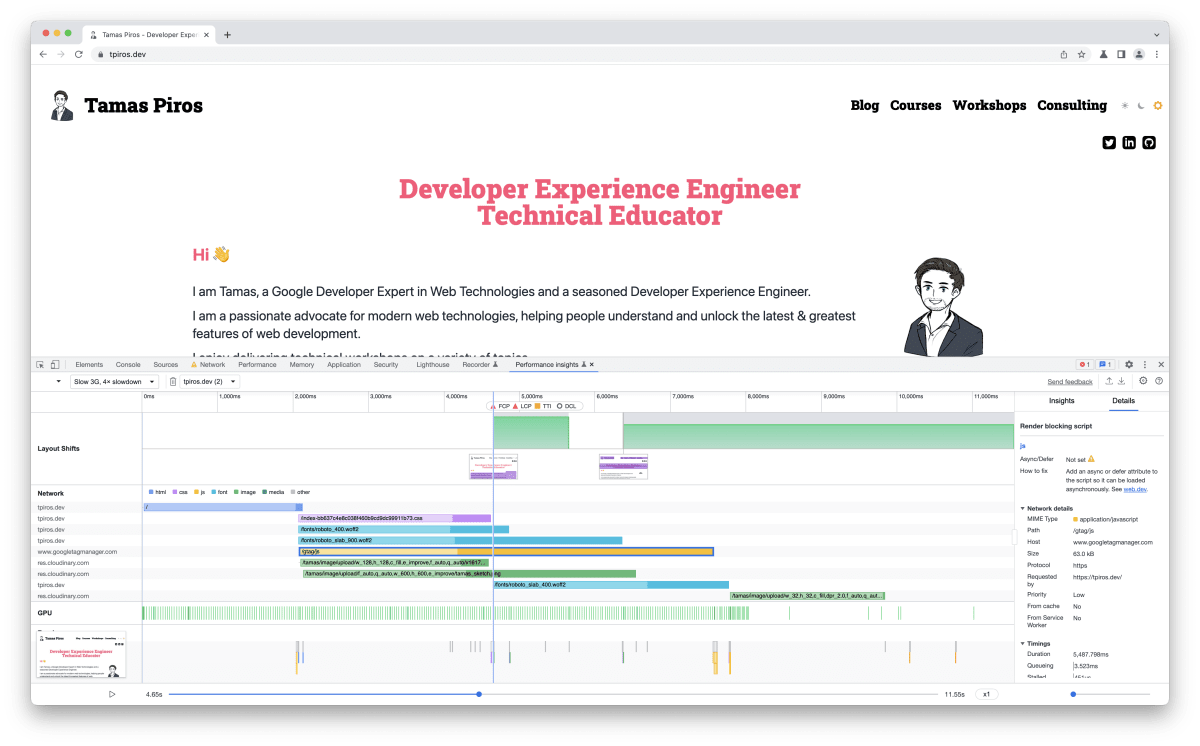
While the Performance Insights is an experimental feature of DevTools it focusses on page load time measurements. When doing a measurement we can also select to throttle both the network and the CPU which helps with measuring load times under different circumstances. The below screenshot shows the performance insight of my site using Network and CPU throttling (Slow 3g, 6x CPU reduction).
Conclusion
I can't wait to see more additions to this panel - it certainly helps to have a much better (and visual) understanding of what is going on with a page. The actionable insights are very useful - especially when the feedback also contains information about the potential cause. Today, the Performance Insights panel works only with measuring page speed and it is available in Chrome Canary 102 (Version 102.0.4974.2). I highly recommend that you try it out and since it's an experimental feature, you can also send feedback to Google, which I'm sure they'll be happy to receive.