Harness - A Local Managed Agent in Four Planes
A few weeks ago Anthropic published Scaling Managed Agents. The piece describes the architecture they moved to after agents stopped being “pets” you could nurse back to health and started being things they run hundreds of millions of a month. The core move is splitting the agent into three planes so each one can improve without dragging the others along: brain, hands, session.
I read it twice, then built a local version in TypeScript. My laptop will never see hundreds of millions of anything. I built it because this kind of architecture only really lands once you’ve typed it out.
The result is a roughly 2,400 line project I called Harness. One SQLite database, one Docker container, one Gemini API key. Runs on a laptop. This post is about what the planes actually look like in code, the parts that were harder than the Anthropic post makes them sound, and the three-zone UI I ended up writing so I could actually watch a turn unfold.
First, what even is a harness?
If you’ve only ever used Claude or ChatGPT through a chat box, words like “agent” and “harness” can sound like marketing fog. Here’s the least-magical version I can give you.
A model is the thing that takes text in and produces text out. Gemini 3. Claude. GPT-5. Given a prompt, it emits a response. That’s all it does. It has no filesystem, no network access, no memory between calls. Every time you send it something, it’s the first time it’s ever seen anything.
A tool is a function you’ve told the model it’s allowed to ask for. Every tool has a name (http.fetch), a short description (“fetch a URL and return the body”), and a JSON schema for its arguments. The model emits structured JSON saying “please call http.fetch with url=https://example.com”. Something else has to actually make that happen.
A harness is the code that sits between the model and the real world and decides what “something else” does. When the model emits a tool call, the harness runs the tool, captures the result, and feeds that result back into the next prompt. It’s a loop:
- Send the conversation so far to the model (plus the list of tools it’s allowed to call).
- Read whatever came back.
- If it asked for a tool, run it, append the result to the conversation, go to step 1.
- If it sent plain text, return it to the user and stop.
That loop is what turns a model into an agent. Agent = model + harness + tools. Remove the harness and you have a chatbot. Add one and the chatbot can run Python, fetch URLs, chain ten operations together, and keep going until the task is done. A turn is one full trip around the loop: “fetch my five most recent GitHub repos and summarize them” is one turn, even if the model had to make three tool calls to finish it.
Every interesting question in agent design is a question about the harness. Where does the conversation state go? What happens if the process crashes mid-turn? What does the model get to see? What does it get to do? Who owns the sandbox? Can the model see secrets? Can it reach 169.254.169.254?
Anthropic’s piece is about the answers they landed on at their scale. This post is about typing those answers out on a laptop so I can feel them.
Three planes, plus one
Anthropic describes three planes. I ended up with four, because secrets kept leaking through my fingers when I tried to cram them into the hands plane.
- Brain. Reasoning. Calls Gemini 3 via Google’s ADK. Stateless per turn.
- Session. The durable event log. SQLite, append-only, one row per event.
- Hand. Sandboxed execution. Docker containers, nsjail, HTTP fetch, anything with side effects.
- Secret. Credential mediation. Encrypted store plus a broker that resolves opaque references at call time.
Three invariants pin the whole thing together. The model never controls the sandbox: it calls code.run({language, source}) and the runtime picks the container. The model never sees raw secrets: only opaque SecretRef handles, resolved by the Secret Broker at call time. Every action is appended to the durable event log before it executes; the SQLite log is the source of truth, and the model context is a projection of it.
Read those carefully. Everything interesting in the codebase is a consequence of those three sentences.
The session is the source of truth
The key claim from the Anthropic post is that the durable event log is the source of truth, and the model’s context window is just a projection of that log. I kept getting this backwards for the first few days of building.
Here it’s a SQLite table indexed by (session_id, seq). Every turn appends: the user message, every model message, every tool call, every tool result. A projection function walks the events and builds a turns[] array that gets seeded into the ADK session at the start of each turn.
The invariant that makes this durable is the ordering. Every event hits the log first. The action runs second. A tool call looks like this end-to-end:
Here’s the wrapper that enforces that ordering in src/brain/tools.ts:
// 1. Validate args against the hand's schema.
const parsed = hand.schema.safeParse(args);
if (!parsed.success) { /* log failure and return */ }

// 2. Append the tool_call event BEFORE running the tool.
deps.sessionStore.append(deps.sessionId, {
  type: 'model.tool_call',
  callId,
  tool: hand.name,
  args: parsed.data as Record<string, unknown>,
});

// 3. Build a HandContext (secret broker, artifact store, audit).
// 4. Invoke the hand.
const result = await hand.invoke(parsed.data, ctx);

// 5. Append the tool.result event.
Kill the process between step 2 and step 5 and the log knows a tool call was attempted but no result came back. Replay the log on restart and the brain can see the dangling call and decide what to do. (Right now “decide what to do” means “tell the user something went sideways.” Smarter recovery is next.)
If you pipe together the brain, the session writes, and the audit writes for a single turn, it looks like this:
The two kinds of log events are worth separating. The [session] lines go into SQLite and are what the model sees on replay. The [audit] lines go into a JSONL file and are what the operator sees when something misbehaves. Both are append-only. Both stay append-only. SQLite does all the hard concurrency work for the session log: the append sits inside an IMMEDIATE transaction, so two turns racing on the same session can’t interleave their events, and I get to write exactly zero concurrency code. I love SQLite.
The container is a tool
This is the part of the Anthropic post that took me longest to internalize. The container is a tool the model calls. Its entire universe is the tool schema. Everything behind the schema belongs to the runtime, and the model has no visibility into any of it.
In practice that means the CodeHand has total control over what the container looks like:
export class CodeHand implements Hand<CodeRunArgs, CodeRunResult> {
  readonly name = 'code.run';
  readonly schema = z.object({
    language: z.enum(['python', 'node', 'bash']),
    source: z.string().min(1),
  });
  // ...
}
The tool schema the model sees is two things: language, source. That’s it. The image (harness/code-sandbox:latest), the memory cap (512 MB), the wall-clock timeout (30 seconds), the mount (a per-call temp dir bind-mounted at /work), the UID, the network policy (--network=none): all of that is decided by the hand. The model cannot negotiate.
The result the model sees is also narrow: { exitCode, stdout, stderr, timedOut }. No container ID, no host paths, no environment variables.
This reads as obvious on the page. Building it was a series of small corrections. My first draft let code.run accept a memory argument, under the theory that “the model knows what it needs.” The model will cheerfully ask for 8 GB of RAM to print “hello world” if you let it.
The secret plane
Secrets are the tricky one. You want the model to be able to call http.fetch('https://api.github.com/user/repos') with auth, but you want the auth token kept out of the model’s context window. Once it’s in context it’s in the event log, in replay output, in whatever the model decides to echo back.
The broker pattern solves this by giving the model opaque handles instead of values. Here’s the shape of the flow:
The tool call the model emits looks like:
{
  "url": "https://api.github.com/user/repos",
  "headers": {
    "Authorization": { "kind": "secret", "name": "github_token" }
  }
}
That’s what lands in the session log. The HTTP hand walks the args, finds every SecretRef, resolves each one against the broker immediately before the fetch, holds the values in a local variable for the duration of one request, and drops them. The audit entry records a single fact: github_token was resolved. The actual value never leaves the broker’s scope.
Traced end-to-end, one secret-bearing turn looks like this:
The secrets store itself is a small AES-256-GCM blob on disk. The master key lives at ~/.harness/secret-key, mode 0600, generated on first run. The key management is crude. It still beats checking tokens into git, which is the honest alternative on a laptop.
The parts that were harder than advertised
nsjail inside Docker, on macOS
The code sandbox uses Docker for filesystem and network isolation, and nsjail inside the container for resource limits and privilege dropping. On Linux this works out of the box. On macOS, Docker Desktop runs containers inside a Linux VM, and nsjail’s default setup uses pivot_root for its mount namespace, which fails inside that VM.
The fix is one line in nsjail.cfg: disable the mount namespace (disable_clone_newns = true) and let Docker handle the filesystem while nsjail handles everything else (UID, PID, IPC, UTS, net namespaces, rlimits). I spent a full evening watching nsjail: pivot_root errors scroll past while I second-guessed my Dockerfile.
DNS-based SSRF policy
The HTTP fetch hand blocks private, loopback, link-local, multicast and reserved CIDR ranges. Blocking by hostname alone is easy to defeat: evil-redirector.example.com can resolve to 169.254.169.254 (the AWS instance metadata endpoint), and a string check that only reads the hostname sails right past it.
The policy in src/hands/http/url-policy.ts does two things. If the hostname is a literal IP, check it directly against the blocklist. Otherwise resolve via DNS and check every returned address. It’s about 30 lines of CIDR math and it’s the piece of the codebase I’m most paranoid about, because the failure mode is “you ship your cloud credentials to a model.”
Observability without plumbing a logger
At some point you want to watch what the system is doing, live, without tailing a file. The obvious move is to inject a logger through every layer and emit structured events. I tried this. It turned every constructor into a parameter bag.
The less obvious move is LogBus: a small module that monkeypatches process.stdout.write and process.stderr.write, parses Pino JSON when it sees it, and broadcasts every line over an EventEmitter. Fastify’s access logs, system warnings, stray console.log calls I forgot about, they all show up. The UI subscribes via SSE and renders them in a bottom console pane.
It’s the kind of code I’d reject in a code review at work. For a local project it’s the right trade: one file, no plumbing, catches everything. The alternative was teaching 12 modules about a logger they didn’t ask for.
What I got wrong
Persistent agents across turns
My first version kept a single ADK LlmAgent alive per session. Turn 2 would call runAsync again and reuse everything. This works poorly, because the tool factory needs to close over the current session ID to route events to the right log, and the factory is built once when the agent is constructed.
The fix is to rebuild the agent and the tool factory every turn, closing over sessionId fresh (see src/brain/worker.ts:76). It costs a few hundred microseconds per turn and removes an entire class of bugs. Stateless per turn, durable in the log. That’s the whole trick.
Inlining large outputs into the event log
I started by putting every stdout straight into tool.result events. Then I tested with a script that printed a megabyte. The SQLite row was a megabyte. The projection sent a megabyte to the model. The context window had opinions.
The fix is artifact refs: outputs above a threshold go to a file-backed blob store, and the event log gets a small reference object ({ kind: 'artifact', id, name, bytes }) in place of the body. The model can pass the ref into the next tool call (a summarizer, say) while the raw bytes stay on disk. Same pattern Anthropic describes for session attachments. I stole it.
Projecting tool calls into turn history
My first projector tried to reconstruct the full tool call history for ADK, building synthetic functionCall and functionResponse parts. It mostly worked. It also broke grounding, because ADK expected its own shape and didn’t appreciate me faking it.
The working version projects only the text turns and lets ADK re-run the tool loop from scratch each turn using its own state. The event log still has every tool call for audit and replay. The projection stays out of ADK’s internals. Simpler, fewer edge cases, same durability guarantees.
The UI that got built for it
I started with curl. Two days in I realized that watching a turn unfold is most of the point of building this locally, and curl wasn’t cutting it.
So there’s a three-zone UI at http://localhost:3000, written as a single HTML file with a pile of hand-written JavaScript that subscribes to SSE endpoints. No framework, no bundler, no build step. Fastify serves ui/index.html statically and the whole thing loads in one request.
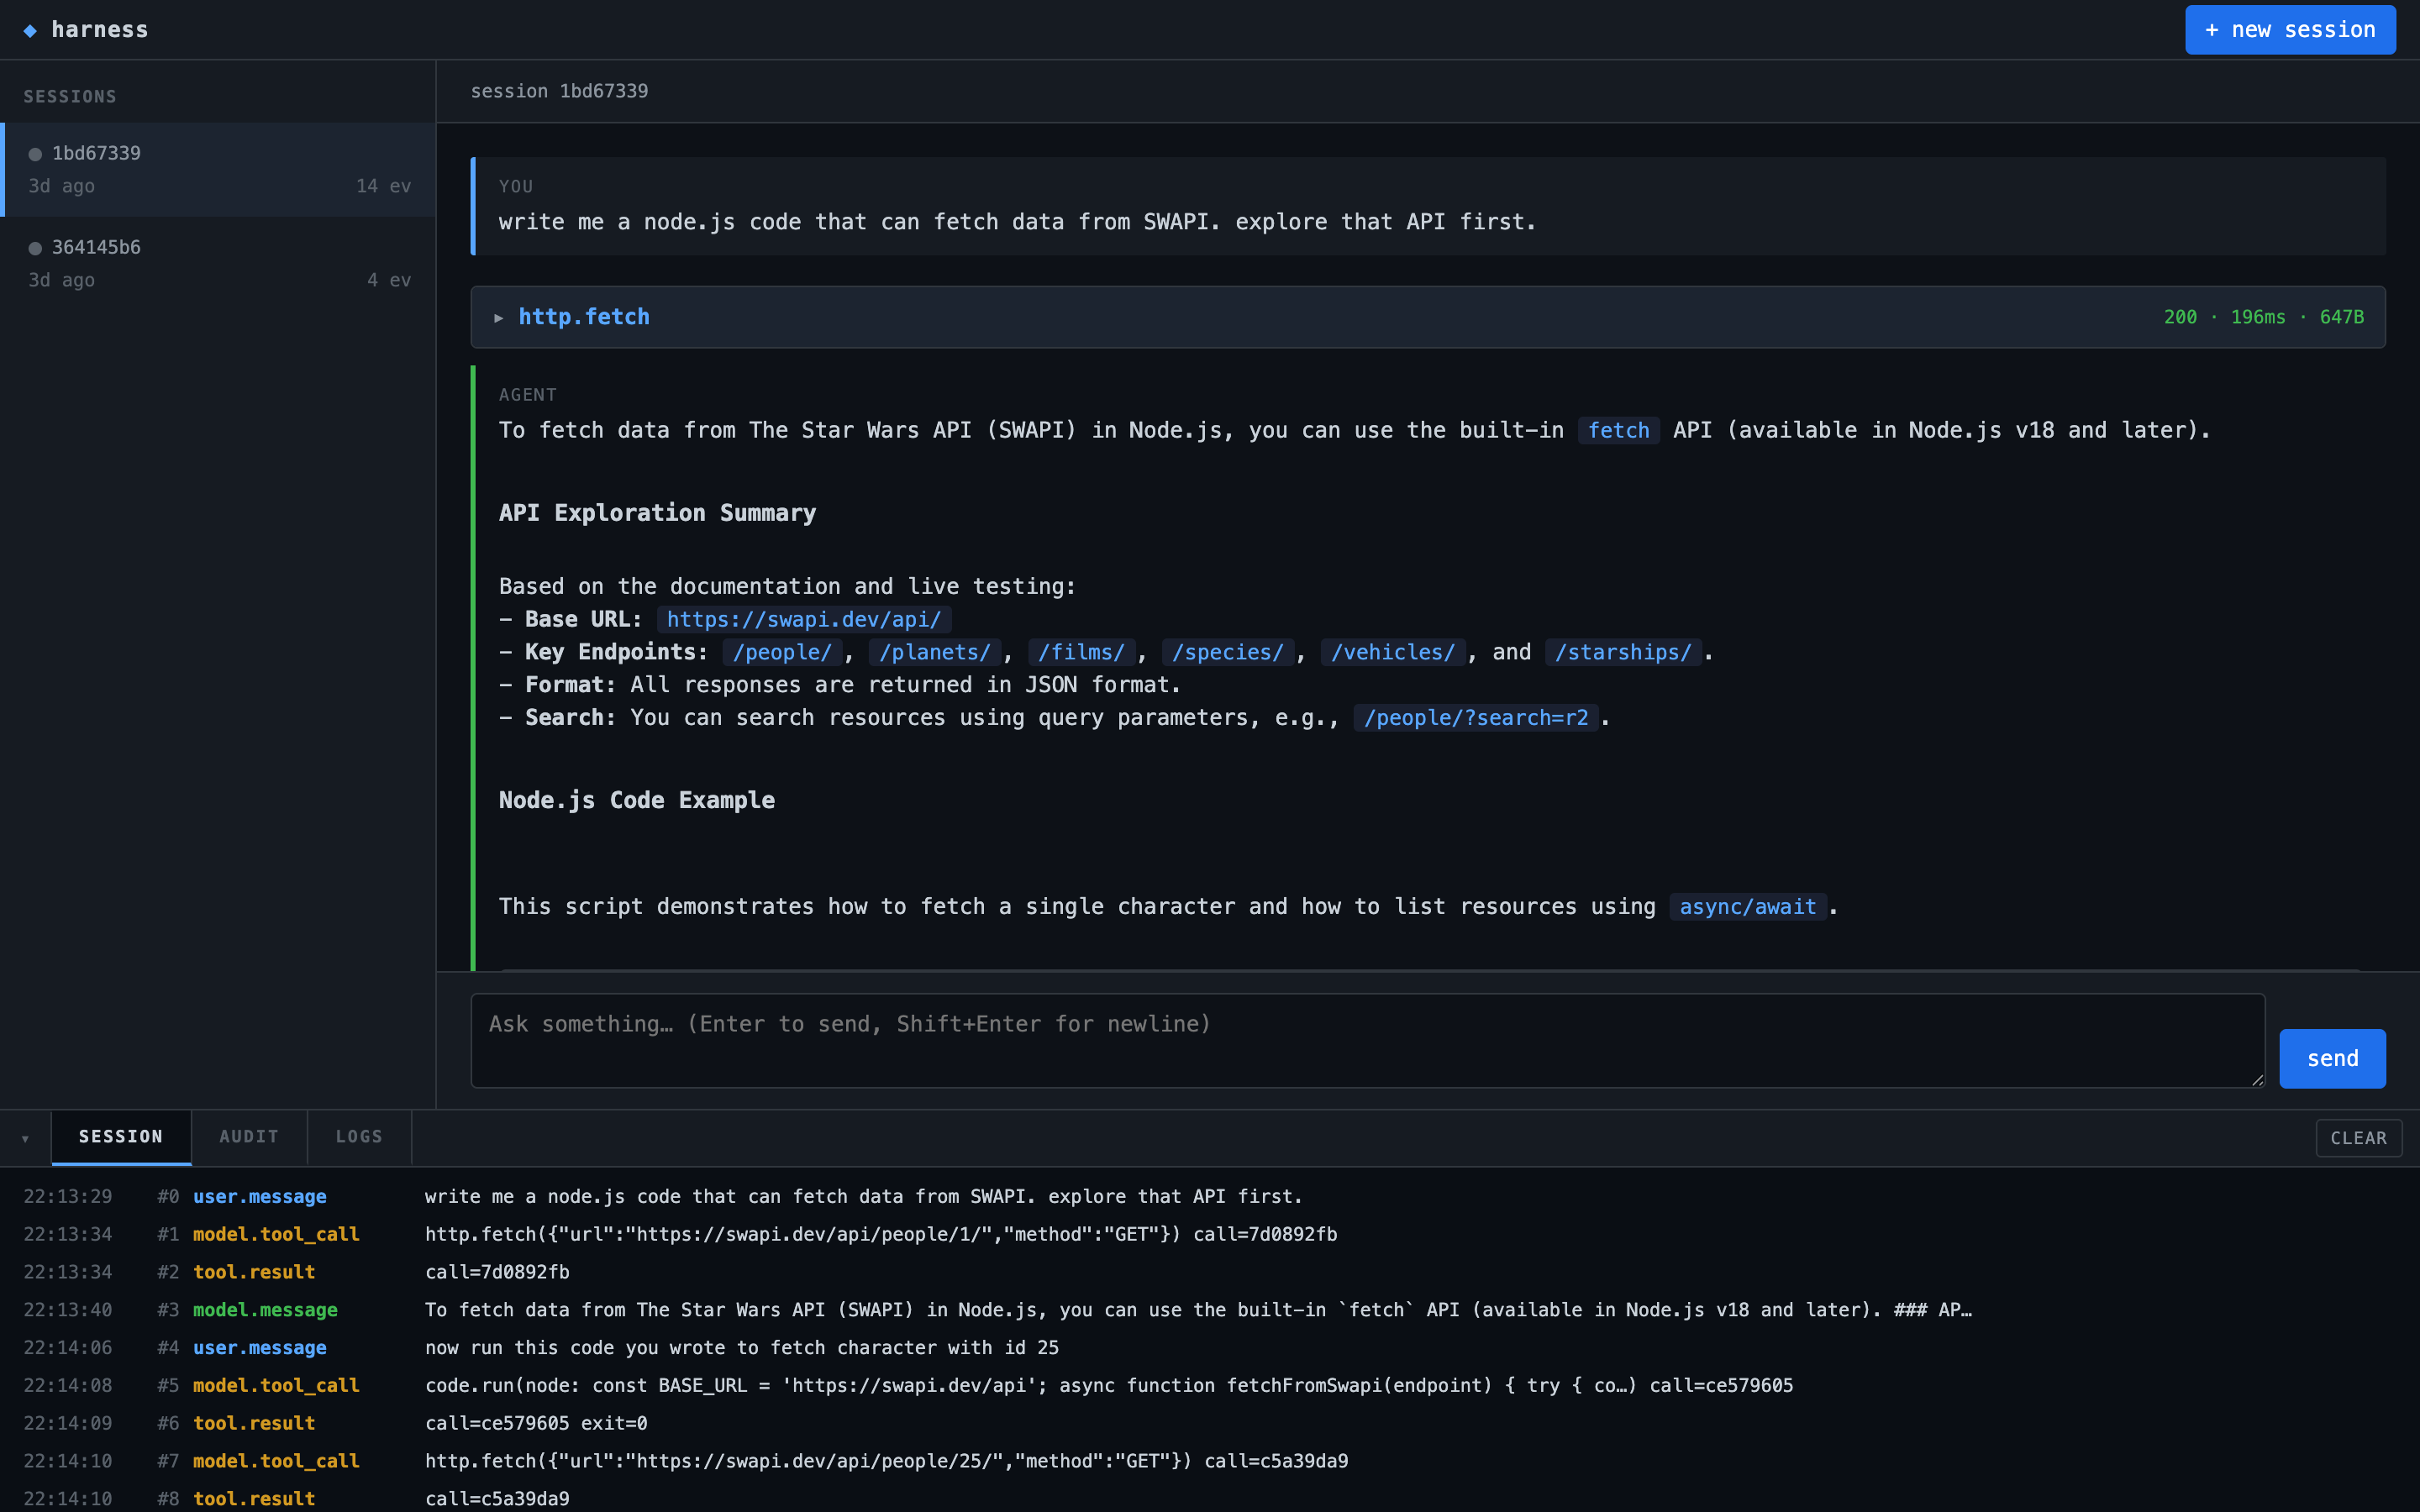
The three zones map directly onto the architecture.
Left: sessions. Each row is a row in the sessions view over the SQLite log. The green dot pulses when a turn is running (the server pushes a list-changed SSE event every time the running set changes). Clicking a row switches the session subscription to that ID.
Middle: the conversation. The projection of the session log, rendered as turn cards. User messages on the left with a blue bar, model messages with a green bar. Tool calls live as collapsible cards between them, showing args and result when you expand. This is the turns[] array the projector builds, rendered with a little markdown on top.
Bottom: the console. Three tabs over three different SSE streams. SESSION tails the durable event log (user.message, model.tool_call, tool.result, model.message). AUDIT tails the audit JSONL (docker.spawn, code.run.begin, secret.resolve, docker.exit). LOGS tails whatever the LogBus pulled off stdout/stderr.
The three tabs exist because they answer different questions. If the model is misbehaving, I read SESSION. If a container is hanging, I read AUDIT. If Fastify is throwing a 500, I read LOGS. One screen, three subscriptions, no polling.
Here’s the AUDIT tab during a Python run. Each tool call produces four entries: code.run.begin, docker.spawn with the full docker run command, docker.exit with byte counts and duration, and code.run.end.
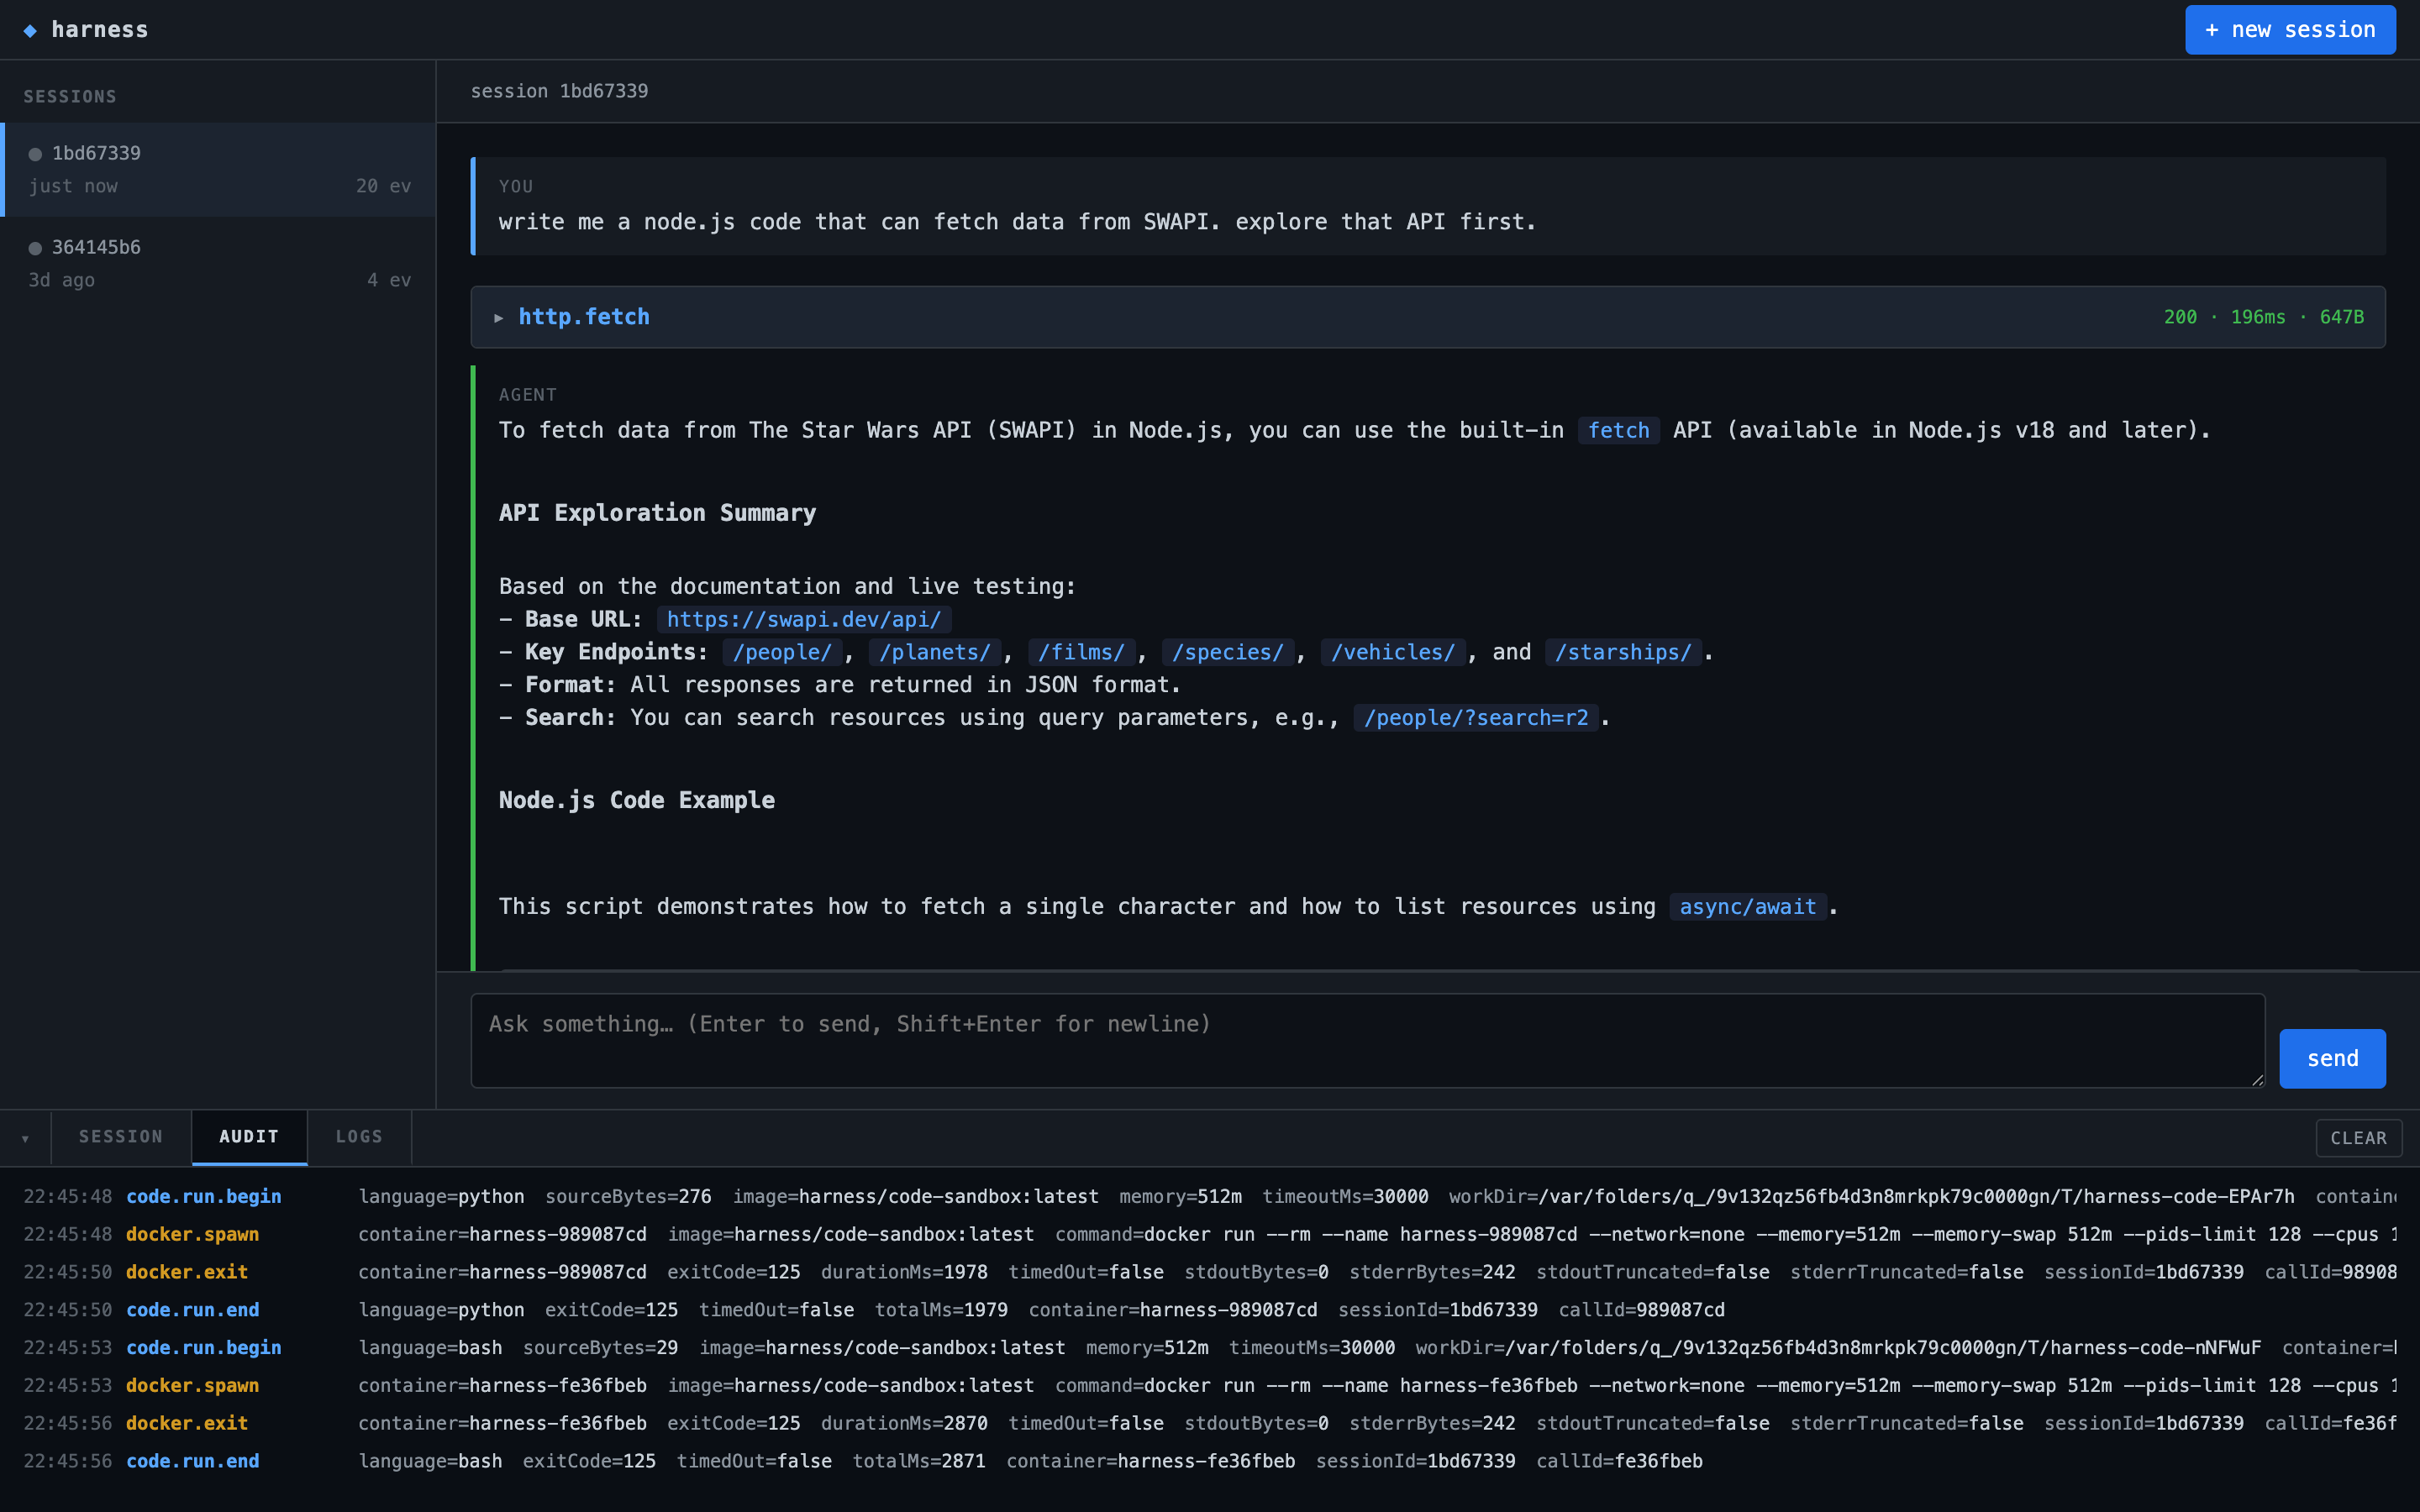
None of those entries are derived from the model output. All of them are observable in real time, from the laptop that launched the container. If the docker args ever drift (say, someone accidentally drops --network=none), I see it in the audit stream before the container does anything interesting.
This is the part of the project I genuinely enjoy building. You send a turn, you watch the log fill up in two different consoles, and the four-plane diagram from the top of this post stops being an abstraction.
What’s left out
Anthropic’s architecture supports warm brain pools (so wake(sessionId) is fast), cross-host session migration, a real credentials proxy, and presumably a hundred other things they didn’t put in the post. Mine does none of those. It’s one process, one laptop, one SQLite file. The recovery path is “kill the process and start it again, the log will sort it out.” The scaling path is “don’t.”
What it does do is make the architecture legible. The brain worker is 200 lines. The session store is 200 lines. The code hand is 140. You can read the whole thing in an afternoon and walk away with a working mental model of how a managed agent decomposes. That was the point.
If you want to poke at it, the code is on my GitHub. Start with src/brain/worker.ts and follow the imports.