Google Chrome introduces a new Performance Insights panel
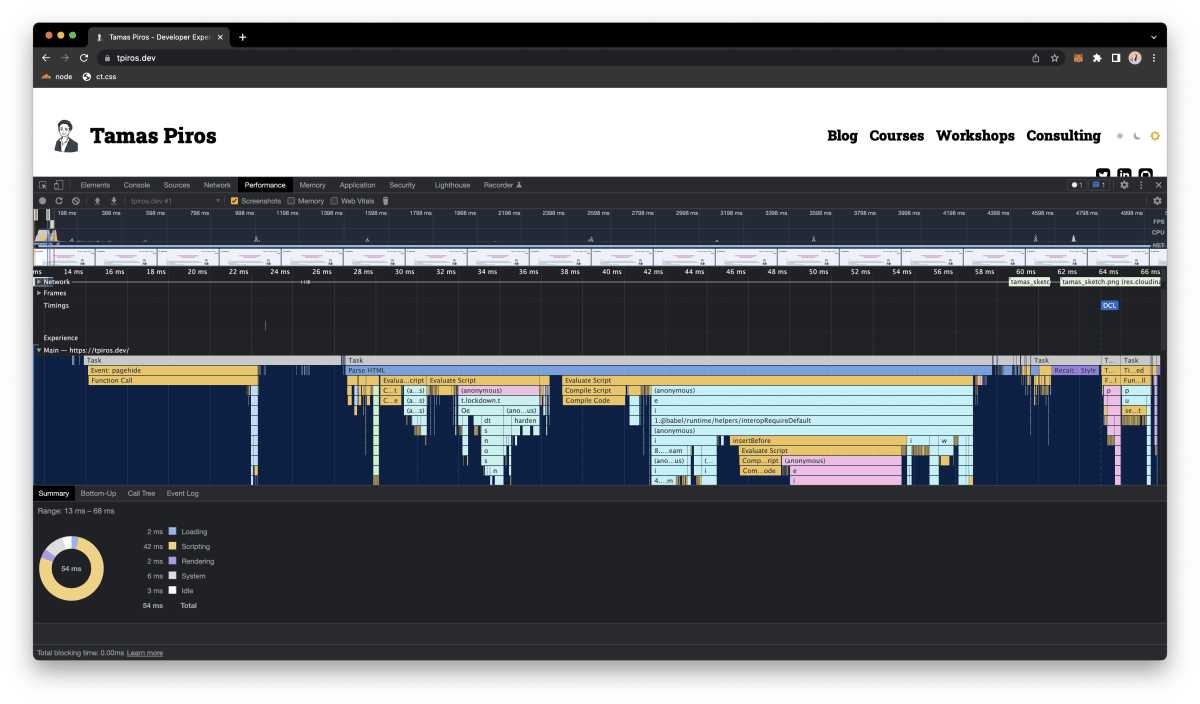
I’ve run quite a few Web Performance workshops over the years and spent plenty of time monitoring site performance. The Chrome Performance panel still scares me. There’s a staggering amount of information crammed into it. Look at the screenshot below. Even for a simple site like this one, there’s a lot going on.
Conversations with other developers (and feedback shared with Google) made it clear: the Performance panel was hard to use and demanded deep technical knowledge of too many moving parts.
Performance Insights - a new panel
The Chrome team listened. They’ve built a brand new panel called Performance Insights, now available as an experimental feature in DevTools.
The new panel is use-case driven and hands developers actionable insights. The layout looks similar to the existing Performance panel, but there are key additions. The replay feature can replay the entire request cycle with an option to pause. You can even drag the timeline manually.
I also found the network requests easier to read and parse compared to the same view in the classic Performance panel.
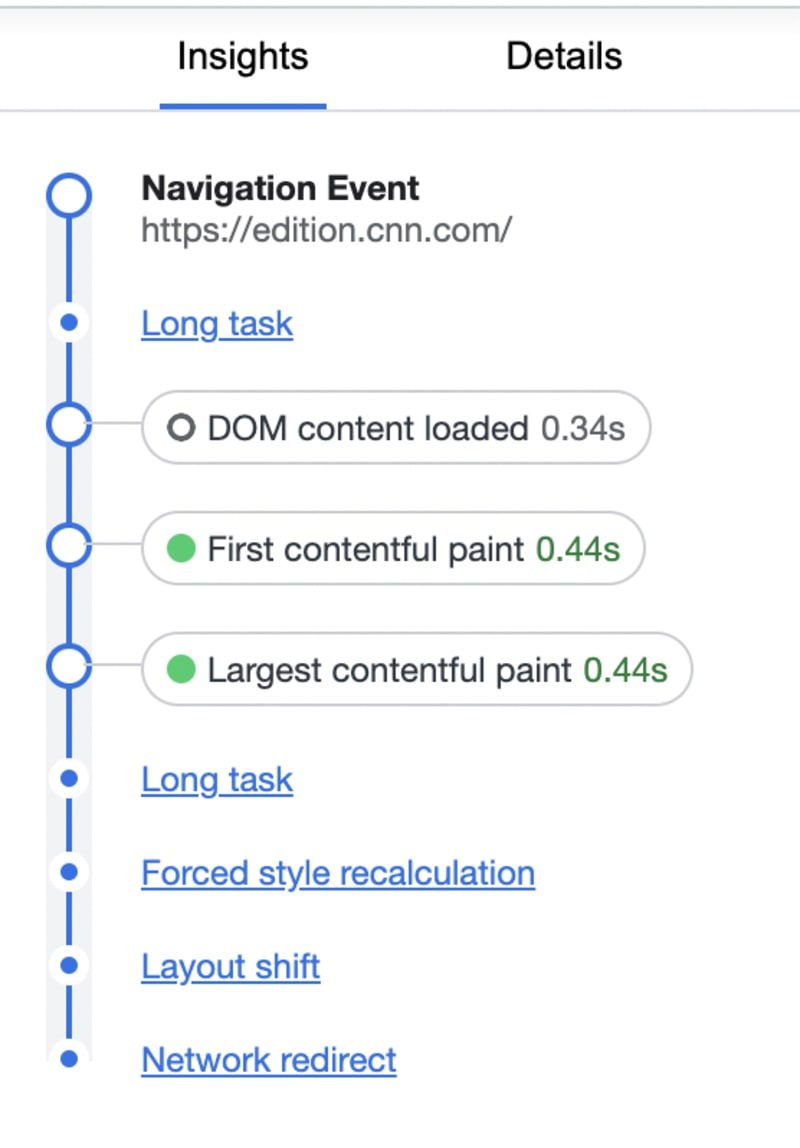
Core Web Vitals
Considerable effort went into surfacing Core Web Vital metrics. The panel measures layout shifts and displays LCP (Largest Contentful Paint), First Contentful Paint, Time To Interactive, and DOM Content Loaded events.
Insights Panel
The standout addition is the Insights side panel. It holds actionable pointers with clear fixes attached. Think of them as the same kind of suggestions you’d get from Lighthouse.
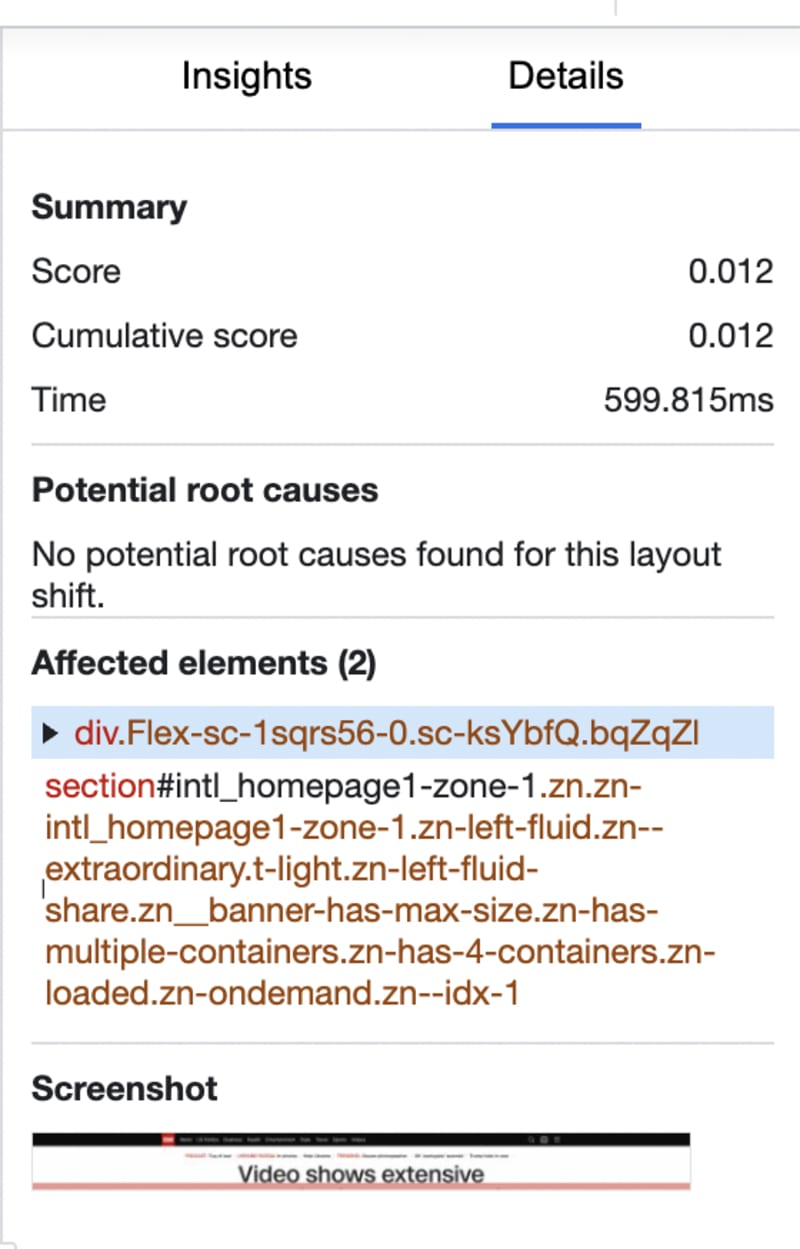
Click a suggestion and you’ll get more detail about the issue. Where applicable, it highlights the element and jumps to the exact point on the timeline where the event occurred.
Measure Page load
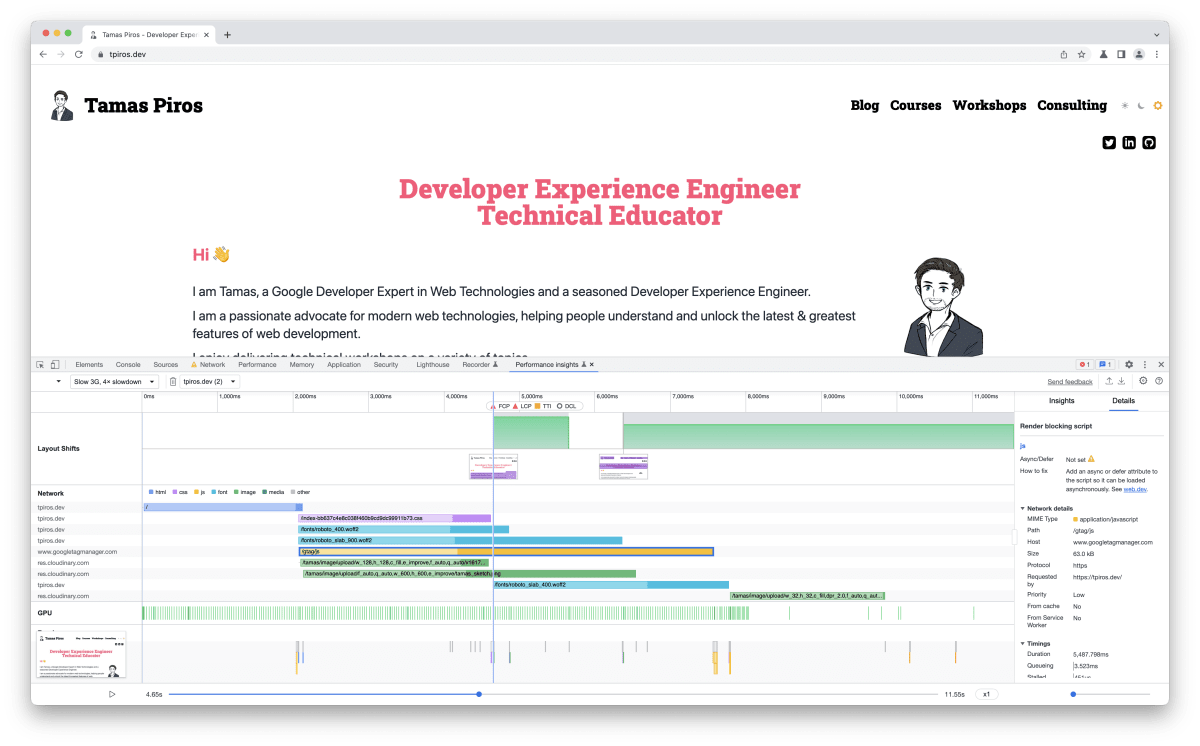
While Performance Insights remains experimental, it focuses on page load time measurements. You can throttle both network and CPU when recording, which helps simulate load times under different conditions. The screenshot below shows my site’s performance insight with network and CPU throttling cranked up (Slow 3G, 6x CPU reduction).
Conclusion
I’m looking forward to seeing more additions land in this panel. It gives you a much better (and more visual) read on what’s happening with a page. The actionable insights are genuinely useful, especially when they flag the probable cause. Right now, the Performance Insights panel only measures page speed and it’s available in Chrome Canary 102 (Version 102.0.4974.2). Give it a spin. It’s an experimental feature, so you can fire feedback straight to Google.