Chapter 14Production
Observability, cost, and deploy
37 min read · 16 of 22
What you’ll build
Thirteen chapters ago you wrote a seven-line script that took a question and returned an answer. The assistant grew. It got structured output, then tools, then retrieval, then memory, then evals, then safety, then a sandbox, then a planner that strings the sub-agents together. By now it researches, writes code, verifies that code, and translates the brief, all in one turn. What it doesn’t have is anywhere to live.
This chapter ships it. By the end the assistant runs as a Hono server, writes a per-event audit log you can grep with jq (and ship to whatever aggregator you already use), enforces per-user budgets, streams responses to the client over SSE, and deploys to a box you control. The chapter also swaps the cumulative build’s workflow shape (Chapter 13’s Plan-and-Execute) for an autonomous agent shape (agent-as-tool from Chapter 6), so the deployable thing is an agent that decides per turn what to do next, instead of following a plan emitted up front.
This is the last chapter of the main arc, and the bonus chapters that follow branch off it rather than continue it. By the end you’ll have shipped.
Once your agent works, is evaluated, and is safe, the next concern is shipping it. Three forces matter, and they pull against each other.
The framework is the Production Triangle: three vertices in tension.
- Observability. What’s the agent doing right now, what did it do an hour ago, what happened during that one bad run last Tuesday?
- Cost. Per call, per user, per day. Without controls the bill is unbounded; with them you know your unit economics.
- Deploy. Where the agent runs, how it’s updated, how you roll back.
More observability costs more (ingest fees), cheaper deploys often mean less observability, and aggressive cost caps reduce the agent’s effectiveness. The chapter teaches the floor for each: the minimum to ship responsibly, and where you grow from there.
The build itself shifts to an autonomous agent-as-tool shape: a single root Agent whose tools are four other Agents wrapped via asTool (Chapter 6 concept 8). The orchestrator decides per turn which specialist to call.
What “production” actually means
For a coding agent in production, you need to be able to answer five questions at any moment.
- What did the agent do? Replay any past run, with all tool calls and their results.
- What’s the agent doing right now? Live trace of in-flight runs.
- How much did it cost? Per run, per user, per day.
- Is it working? Pass rate on your eval suite over time. Latency p50/p95.
- Who broke it, when? Diff agent quality against deploys.
Every layer of the production triangle exists to answer one or more of those five questions.
The five questions also place this chapter in the larger picture. They correspond to the phases every production AI system passes through:
- Build. The model, tools, memory, retrieval, and agent kernels from Chapters 1-9.
- Test. Chapter 10’s evals, judges, and tracking.
- Deploy. This chapter’s Hono server, deploy target, and rollback procedure.
- Monitor. This chapter’s per-run logs, per-event traces, and dashboards.
- Govern. The cross-cutting concern: Chapter 11’s safety filters, the cost caps below, and the permission discipline gating what tools the agent can call.
The Production Triangle that organises this chapter is the trade-off layer over deploy and monitor; the lifecycle is the larger map that connects everything you’ve built.
Concept 1: The Production Triangle
This framework organises the chapter, and you’ll reuse it on every AI product you ship after it. Skip one vertex of the triangle and the failure mode is predictable: without observability you can’t debug, without cost controls the bill explodes, and without deploy discipline you can’t ship updates fast enough to fix what the other two just showed you. The three are interdependent; knowing the framework lets you reason about trade-offs explicitly instead of stumbling into them.
Push hard on any one vertex and the others move.
Crank up observability and ingest fees rise, the deploy grows a tracer agent that adds latency, and cost goes up.
Get strict about cost and maybe you can’t afford verbose tracing anymore, so observability suffers, and you ship later because every deploy needs a cost-control layer.
Pick the cheapest deploy and you might lose long-running execution: your agent has to fit a 10-second timeout, observability spans get truncated, and you can’t run the cost-tracking sidecar.
Set a floor for each, then negotiate the trade-offs deliberately. Maximising all three at once is what burns budget without a clear win on any of them.
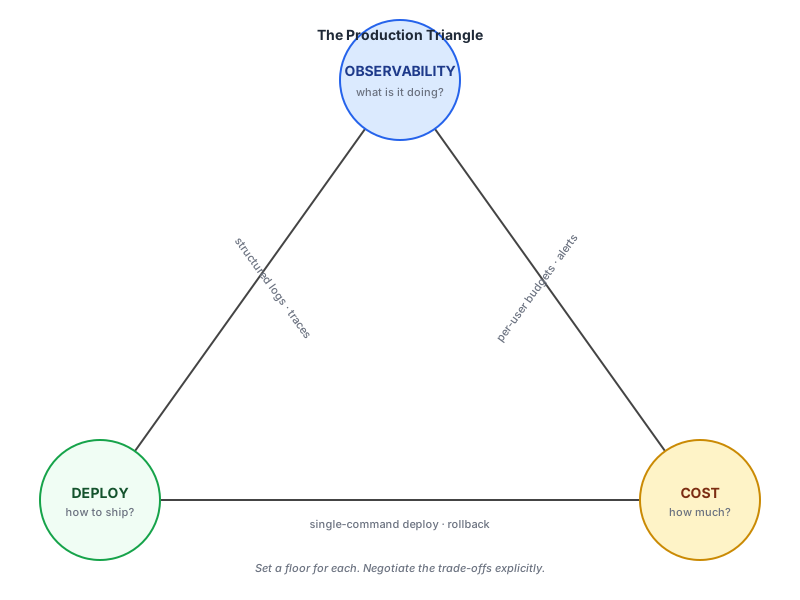
The floor for each:
- Observability floor. Per-run structured logs, captured to a queryable store. Aggregate metrics (pass rate, cost, latency) updated daily.
- Cost floor. Hard per-user budgets. Per-run iteration cap (Chapter 6). Daily aggregate cost alert.
- Deploy floor. Single-command deploy. Rollback in under 5 minutes. Health check.
Anything below these floors is a gamble you’ll eventually lose; anything above is up to your context. The triangle is the lens for the rest of the chapter: observability, cost, and deploy each get a concept of their own.
Concept 2: Structured Per-Run Logs
The first floor of observability is just capturing what happened: a structured JSON entry per agent run that says this user asked this question, the agent did these things, here’s what came back, here’s what it cost. Fancy traces and flame graphs come later.
Everything else builds on this layer; skip it and you’re debugging blind. With it in place, most “what happened” questions never leave your log aggregator.
The mechanics: one JSON line per run, written to stderr or a log file, capturing timestamps, duration, model calls, tool calls with results, exit reason, and token spend. Pipe to disk; ingest into a log aggregator (Datadog, Honeycomb, Loki, CloudWatch, anything that takes JSON); query when something goes wrong.
A few months in, your structured logs are the agent’s memory of its own production behaviour, queryable for any question you can express as a filter.
The minimum useful log
interface RunLog {
  run_id: string;
  user_id: string;
  ts: number;
  question: string;
  iterations: number;
  tool_calls: string[];
  tokens_used: number;
  reason: "done" | "iteration_limit" | "token_limit" | "error";
  duration_ms: number;
  answer_preview: string;
  cost_usd: number;
}

function logRun(log: RunLog) {
  console.log(JSON.stringify(log));
}
Walking through this.
Lines 1-13. The schema. A typed interface so you can’t accidentally drop fields. Eleven fields covering what you’d actually query later: who asked, what they asked, how much it took, what tools ran, why it ended, what came back.
tool_calls: string[]. Names only. The audit log (Chapter 11) captures the full per-call detail; this run-level log is for aggregate questions (“how often does the agent call retrieve_docs?”).
reason. A typed enum of termination reasons. “done” is normal. “iteration_limit” or “token_limit” means the runtime cap fired. “error” means something threw. You’ll filter on this constantly.
answer_preview. First 200 characters or so of the answer. Enough for at-a-glance triage; not enough to leak full PII into log storage.
Line 16. console.log(JSON.stringify(log)). That’s the whole shipping mechanism. Pipe stdout into your log aggregator. You can query the last 1,000 runs for reason: iteration_limit and find the questions that stuck the agent.
That’s the floor of observability: one JSON entry per run, queryable indefinitely.
Concept 3: Per-event traces
Per-run logs answer “what happened” at the run level. Traces answer “what happened” at the call level: every model call, every tool call, every retrieval, with timings and inputs and outputs. When the run-level log says “the orchestrator hit the iteration cap,” the trace tells you which sub-agent it called, in what order, with what arguments, and where it got stuck.
For an agent-as-tool build (the shape this chapter lands on) the trace question is sharper still: which specialist did the orchestrator pick at each turn, and why? That decision sequence is the most important debugging signal you have. If the orchestrator skipped ContentValidator on a question that needed it, you want to see the gap in the trace.
A flame graph shows where the time went. One bar per span: the agent run took 90 seconds total, ResearchScout took 14s, ContentValidator took 4s, CodeAuthor took 6s, CodeVerifier took 2s, the orchestrator’s own model calls between specialists took the remaining 64s. You see at a glance which span owns each cost.
AI traces are the same shape. The orchestrator run is the parent span. Inside it, one child span per specialist call, one per tool call inside that specialist, one per fetch or sandbox invocation. Click any span to see its inputs, outputs, duration.
The audit log we already have
The cumulative build’s audit stream is already a per-event trace. Chapters 11 and 13 wrote it to stderr; this chapter moves it to a dedicated ./audit.log file so it survives the process and greps cleanly. Every meaningful action writes one JSON line:
{"ts":1778355856265,"event":"http_fetch_start","url":"https://swapi.info/api/people/1","method":"GET"}
{"ts":1778355856612,"event":"http_fetch_end","url":"https://swapi.info/api/people/1","status":200,"bytes":727,"truncated":false,"durationMs":347}
{"ts":1778355861440,"event":"orchestrator_tool_call","tool":"researchScout","callIndex":1}
{"ts":1778355875213,"event":"orchestrator_tool_call","tool":"contentValidator","callIndex":2}
{"ts":1778355877801,"event":"orchestrator_tool_call","tool":"codeAuthor","callIndex":3}
{"ts":1778355883994,"event":"orchestrator_tool_call","tool":"codeVerifier","callIndex":4}
{"ts":1778355885903,"event":"tool_call_executed","tool":"execute_code","language":"js","bytes":446}
{"ts":1778355886093,"event":"sandbox_exit","ok":true,"exitCode":0,"durationMs":190,"stdoutLen":430}
{"ts":1778355891670,"event":"orchestrator_done","toolCallCount":4,"toolCallTally":{"researchScout":1,"contentValidator":1,"codeAuthor":1,"codeVerifier":1}}
Read top to bottom and you’ve reconstructed the entire run. The orchestrator picked four specialists in order, the CodeVerifier ran a 446-byte snippet that exited cleanly in 190ms, the whole thing finished. If the orchestrator had re-invoked ResearchScout because ContentValidator returned {ok: false, gaps: [...]}, the second call would show up as orchestrator_tool_call with callIndex: 5 and tool: "researchScout". The decision sequence is right there in the file.
Useful queries:
# Which specialists got called this week, by frequency?
jq -r 'select(.event=="orchestrator_tool_call") | .tool' audit.log | sort | uniq -c | sort -rn

# Which sandbox runs failed?
jq -c 'select(.event=="sandbox_exit" and .ok==false)' audit.log

# How long did the slowest http fetches take?
jq -r 'select(.event=="http_fetch_end") | "\(.durationMs)ms \(.url)"' audit.log | sort -rn | head
A logging rule that compounds
As you grow the audit log, the rule that ages well: keep success entries small, make failure entries fat. On success, log the minimum needed to compute aggregates (duration, status, byte count). On failure, log enough to reconstruct the failed call without rerunning the agent: full request, response body, stack trace, surrounding state. The audit log’s value as a debugging tool depends on the failure entries being self-contained; you don’t want to discover at 2am that the production trace says only “fetch failed” with no payload to inspect.
When to graduate to a hosted trace backend
Hosted backends (Langfuse, Phoenix/Arize, Braintrust, Datadog) buy you three things flat-file traces don’t: a trace-tree UI you can click around, automatic correlation across runs, and team-shareable views. The shape stays the same; the storage and the UI change. For a Node-first team, the integration is usually a few lines of OpenTelemetry instrumentation per event, with the backend ingesting via OTLP.
Pick one and commit when (a) more than two engineers need to inspect production runs, or (b) trace volume gets too large to grep, or (c) you need cost/latency dashboards across many users. Until then, the audit log + jq is enough.
Per-run logs answer aggregate questions; per-event traces answer per-call ones, and the book’s flat-file audit.log is already one. Hosted backends are the upgrade path for when grep stops scaling.
Concept 4: Cost Engineering
LLM costs scale with usage. Without controls, a misbehaving prompt or a malicious user can spike your bill from $50/day to $5,000/day in an afternoon. With controls, you know your unit economics, and “the bill” is a knob you can turn.
Unbounded cost is what gets people fired. The techniques here bound it: per-call caps from Chapter 6’s runtime are the baseline; per-user daily budgets, model selection by question complexity, and caching add the rest. Each technique closes one specific leak path. Apply them in order of impact, based on where your real costs are.
Real numbers, verified against Gemini’s pricing page (August 2026, paid tier).
A single agent run on Gemini 3.5 Flash (the model every call in this chapter’s build uses) averaging 8 model calls and 5,000 tokens each. Assume an 80/20 input-to-output split per call: ~32,000 input + ~8,000 output tokens. At Flash’s paid pricing of $1.50/M input and $9.00/M output, that’s 32,000 × $1.50/1M + 8,000 × $9.00/1M ≈ $0.12 per run. For 100,000 runs per day: ~$12,000/day, and that’s the cheap workhorse tier.
For a heavier agent on Gemini 3.1 Pro ($2.00/M input, $12.00/M output for prompts ≤ 200k tokens; jumps to $4/$18 above), with 50,000-token runs (research + retrieval + tool use + reflection) (40,000 input + 10,000 output): 40,000 × $2/1M + 10,000 × $12/1M ≈ $0.20 per run. 100,000/day = $20,000/day, which is still real money.
The five techniques.
1. Pick the right model per task. Routing (Chapter 6). Use Flash-Lite for classification, Flash for the workhorse, Pro only when you’ve measured the quality lift is worth the price gap.
2. Cache aggressively. Gemini’s implicit caching (Chapter 2) is free. Place stable prompt prefixes at the start. The explicit API Chapter 2 promised, cachedContent, buys guaranteed savings on a large stable input: upload it once, reference it per call, and cached tokens bill at $0.15/M on Flash (a tenth of the input rate) plus $1.00/M per hour of storage. Worth it when many calls share a multi-thousand-token prefix; do the arithmetic against the storage fee first. For deterministic queries (semantic dedup), cache responses in Redis with a 24h TTL.
3. Cap per-run cost. Chapter 6’s iteration cap bounds a single run; this chapter’s server adds a per-user daily budget that fails closed. The shipped budget counts requests; for a true token budget, sum the usageMetadata.totalTokenCount each call returns (the end of this chapter shows how).
4. Reduce iterations. A 10-iteration agent costs 5x a 2-iteration agent. Tighter prompts, better tool design, and reflection only when you’ve measured it changing the answer: all reduce iterations.
5. Track unit economics. Cost per user, cost per resolved question, cost per “success” in your domain. If your unit economics don’t work, you have a product problem, not just a cost problem.
For an agent built by a small team, the relevant tooling is short:
- The audit log with
jqqueries for per-user / per-tool spend attribution. Graduate to Langfuse / Braintrust / Helicone when more than two engineers need a clickable UI. - Stripe billing data to compare cost-per-user to revenue-per-user.
- A daily aggregate alert in your monitoring tool when cost crosses a threshold.
The first three techniques cover most of the savings; the last two turn cost management into an ongoing habit.
Concept 5: Streaming via SSE
Almost every consumer-facing agent streams its output. The user sees tokens appear one at a time instead of waiting 8 seconds for a wall of text. Perceived latency drops sharply; cost is identical. For agents that take seconds to respond, streaming is the difference between “feels fast” and “feels broken.” For backend-only agents it’s irrelevant.
Total response time stays the same with streaming; only the perception moves. For a 10-second response, “first token at t=0.8s” versus “everything at t=10s” is the gap between snappy and slow.
Single-shot streaming (the textbook case)
For a single Gemini call, the SDK exposes a chunk stream you read like an async iterable. Inside a Hono route, wrap it with streamSSE, Hono’s Server-Sent Events helper:
import { streamSSE } from "hono/streaming";

app.post("/echo", async (c) => {
  const { prompt } = await c.req.json();
  return streamSSE(c, async (sse) => {
    const stream = await ai.models.generateContentStream({
      model: "gemini-3.5-flash",
      contents: prompt,
    });
    for await (const chunk of stream) {
      const text = chunk.text;
      if (text) await sse.writeSSE({ data: text });
    }
  });
});
Each chunk is a partial string. The browser reads them off a streamed fetch response and concatenates (the EventSource API can’t call this route: it only issues GET requests with no body, and this endpoint is a POST). Same total work as a non-streaming call; perceived latency drops from “answer arrives at t=8s” to “first token at t=0.5s, rest fills in.”
Multi-step streaming (what the chapter’s build actually does)
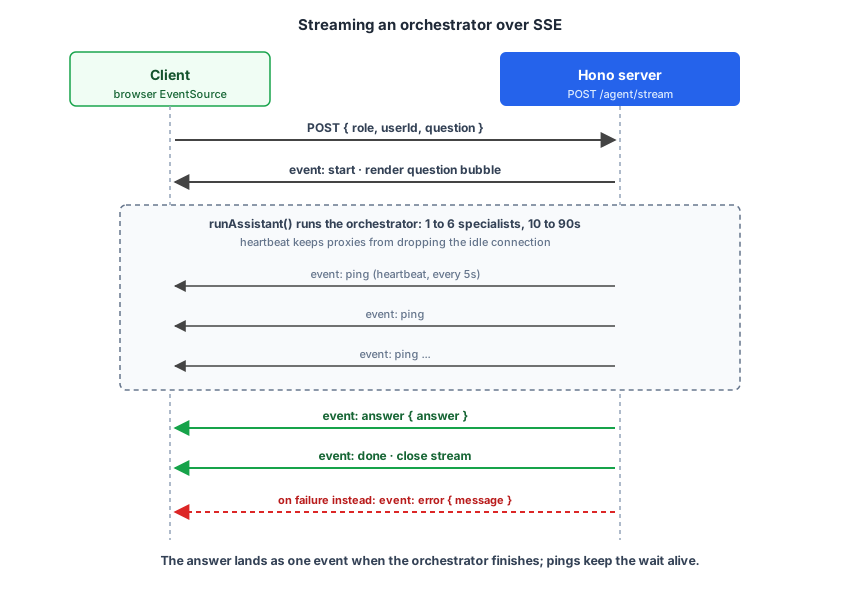
This chapter’s orchestrator is multi-step: it calls 1-6 specialists before the brief is ready. The final answer isn’t ready until the orchestrator finishes, so token-level streaming of the output would mean nothing for most of the request’s wall clock. What the user wants is progress visibility: which specialist is running, how long has it taken, what came back.
The SSE shape is the same; the events are different:
import { streamSSE } from "hono/streaming";
import { runAssistant } from "./assistant.ts";

app.post("/agent/stream", async (c) => {
  const { role, userId, question } = await c.req.json();
  return streamSSE(c, async (sse) => {
    await sse.writeSSE({ event: "start", data: JSON.stringify({ question }) });

    // Heartbeat so proxies don't kill an idle connection during the
    // orchestrator's 10-90s wall clock. One ping every 5 seconds.
    const heartbeat = setInterval(() => {
      sse.writeSSE({ event: "ping", data: String(Date.now()) }).catch(() => {});
    }, 5000);

    try {
      const answer = await runAssistant(role, userId, question);
      clearInterval(heartbeat);
      await sse.writeSSE({ event: "answer", data: JSON.stringify({ answer }) });
      await sse.writeSSE({ event: "done", data: "{}" });
    } catch (err) {
      clearInterval(heartbeat);
      await sse.writeSSE({ event: "error", data: JSON.stringify({ error: (err as Error).message }) });
    }
  });
});
Walking through this.
Lines 1-2. Hono’s SSE helper plus this chapter’s runAssistant.
Line 7. A start event with the original question. The client UI uses this to render the user’s bubble immediately.
Lines 9-13. A heartbeat. SSE connections die if a proxy (CDN, Vercel edge, Cloudflare) sees no traffic for 30-60 seconds. A 5-second ping keeps the connection warm during the orchestrator’s 10-90s wall clock.
Lines 15-23. Run the assistant; emit answer + done on success, error on failure. The heartbeat clears in both branches so it doesn’t leak.
To upgrade this to per-step progress events (“specialist 2 of 4 → verify”), the orchestrator’s tool-dispatch wrapper needs to publish events to a channel the SSE handler reads. The build’s log() function already prints those lines to stderr; routing them to an in-memory pub/sub (or a process-shared EventEmitter) and writing each one to SSE is a small extension on top of what’s already there. The chapter’s code/chapter-14/server.ts ships the simpler shape (start + heartbeat + answer + done) so you can read the whole server in one sitting; the per-step variant is in the README’s “extensions” section.
Three engineering concerns turn streaming from “easy demo” into “production-shape”
Tool calls and streaming don’t mix cleanly. When the model emits a tool call, the streaming “answer” pauses while the tool runs. From the client’s perspective, the stream stops mid-flight. Two patterns handle this.
- Status events alongside tokens:
{ event: "tool_call_start", name: "vector_retrieve" }, then{ event: "tool_call_complete" }, then more tokens. The UI shows a “looking up sources…” indicator during the gap. - Buffer until done: skip streaming while tools are running; stream the final user-facing answer only. Simpler, less responsive UX.
Structured output and streaming work together but require partial JSON parsing. The model streams JSON character-by-character. Until the closing brace arrives, the partial JSON is invalid. Libraries like partial-json parse incrementally so you can render progressive UI (a streaming list of items, for example). Don’t try to JSON.parse mid-stream; you’ll throw constantly.
Backpressure and timeouts. SSE streams can stall if the client is slow. Hono and most Node servers handle backpressure correctly by default. What you have to handle: a timeout on the stream as a whole. If the model generates for 5 minutes for some reason, you want the stream to error out, not hang. Set an explicit config: { abortSignal: AbortSignal.timeout(60_000) } on the SDK call.
When not to stream
A short list of cases where streaming is wrong.
- Batch processing (you’re calling the agent for a thousand documents and storing the results).
- Backend-to-backend calls where no human waits.
- Cases where you need the full answer for downstream processing (eval gates, schema validation) before doing anything else.
Streaming is a UX feature; if there’s no UX, skip it. The companion code includes both versions of the assistant, streaming and non-streaming, so you can compare.
Stream when a human is waiting on the response; otherwise don’t. SSE on the wire, Hono helpers in the server, a streamed fetch in the browser.
Concept 6: The Hono Deploy Pattern
The agent now has observability, cost caps, and streaming. What’s left is a server to wrap it in and a place to deploy it. For a TypeScript-first team, the answer is Hono on a serverless platform (Vercel, Fly, Cloudflare Workers, depending on your scale). Hono is fast, runtime-agnostic, one dependency, and the boilerplate is short.
Hono is a TypeScript-native web framework with the same shape as Express (app.get, app.post, middleware) but designed for the modern JavaScript runtime: edge-compatible, much smaller, runs on Bun, Deno, Cloudflare Workers, and Vercel Edge as readily as on Node. The framework doesn’t care where it runs; that portability is the point.
The smallest viable deploy
import { serve } from "@hono/node-server";
import { Hono } from "hono";
import { runAssistant } from "./assistant.ts";

const app = new Hono();

app.get("/healthz", (c) => c.text("ok"));

app.post("/agent", async (c) => {
  const { role, userId, question } = await c.req.json();
  const start = Date.now();
  const answer = await runAssistant(role, userId, question);
  return c.json({ answer, duration_ms: Date.now() - start });
});

serve({ fetch: app.fetch, port: 3000 });
Walking through this.
Lines 1-3. Three imports: the Node server adapter, Hono, and this chapter’s autonomous runAssistant. The assistant is the cumulative build (the ResearchOrchestrator root agent + 4 specialists wrapped via asTool + Docker sandbox + http_fetch + memory). The server is a thin wrapper.
Line 5. Create the Hono app.
Line 7. A health check. Required by every deploy platform for readiness probes. Put it first so platform readiness checks don’t get queued behind real requests.
Lines 9-14. The agent endpoint. Read role + userId + question from the JSON body, call the assistant, return the answer with the duration. The role gates execute_code (dev only) per Chapter 11; the userId scopes the per-user memory per Chapter 9. The duration belongs in the response so the client can surface it without parsing the audit log.
Line 16. Bind the app to port 3000.
Sixteen lines including imports. Add a per-user budget and a streaming variant and you’re at ~150 lines total. The full version is in code/chapter-14/server.ts.
Three deploy patterns by scale
- Vercel Functions. Cheap, scales to zero. With Vercel’s Fluid Compute, current limits (mid-2026) are Hobby 300s (5 minutes), Pro and Enterprise 800s (up to 1800s in beta). Good for question-answer agents that finish in well under the limit. Great for hobby and small SaaS.
- Fly.io / Railway / Render (long-running container). Pays for idle CPU but no timeout. Good for agents with long-running tasks (research agents, code agents), and for anything with local state or a Docker dependency.
- Inngest / Trigger.dev / Temporal (durable execution). Agent steps are functions; the platform handles retries, persistence across iterations, replays. The right pattern for any agent that runs >60s or needs durability across restarts.
For most readers’ first ship: Vercel Functions for sub-30s stateless agents, Fly.io for longer ones. Graduate to durable execution when sessions outlive single requests.
One honest caveat about this chapter’s build: it needs the container tier. The sandbox spawns the docker CLI, memory lives in a local memory.sqlite, and the audit log appends to a local file. None of that survives on a serverless platform, where there’s no Docker daemon and the filesystem resets between invocations. Hono is the HTTP layer and the same Hono code runs everywhere; the dependencies are what pick the platform.
A week in production: what the dashboards show
Here’s what one week of operating the deployed assistant looks like.
Monday morning. You check the daily aggregate cost alert. It’s at $42 yesterday, in line with the past week’s average. You query the audit log for the slowest 10 runs over the weekend (jq -r 'select(.event=="response_sent") | "\(.durationMs)ms"' audit.log | sort -rn | head). Two of them spent 12 seconds in a single ResearchScout call; the embedding service is having latency variance. You file a ticket for the retrieval team.
Tuesday. A new feature ships. The eval suite passes in CI but the deploy is gated on a manual review of the diff. You read the prompt change, approve, deploy. You tail the audit log for the next hour to confirm new prompts behave on real traffic.
Wednesday. A user reports that the agent gave a wrong answer about your refund policy. You pull the run from the audit log using the run id from the user’s screenshot. Trace shows the agent retrieved the wrong document because the policy was indexed under a different version of the document name. You fix the indexing, add the user’s question to the eval suite, deploy, monitor.
Thursday. Cost ticks up to $58. You query the audit log per-user (jq -r 'select(.event=="request") | .userId' audit.log | sort | uniq -c | sort -rn | head) and find one account responsible for 40% of the day’s runs. Investigation: it’s a script someone wrote that hits the endpoint every 30 seconds. Per-user budget kicks in at the day’s threshold; the script gets throttled. Email goes out to the user explaining the limit. Bill stays under control.
Friday. Weekly eval suite review (Chapter 10’s habit). One question’s pass rate has slipped from 95% to 80% over the past two weeks. You spot-check three failing outputs; the LLM judge has been overly lenient because the rubric needed sharpening for a class of follow-up questions. You re-anchor the rubric with two new examples; pass rate stabilises.
Weekend. No alerts. The system runs itself. The eval suite ran nightly without intervention; the cost stayed within budget; no production incidents.
That’s a “good” week of agent operations, and it’s what the Production Triangle floor buys you. Observability triaged Monday’s slow runs and Wednesday’s bad answer. Cost caps stopped Thursday’s script at the threshold instead of a $400 bill. Deploy discipline shipped Tuesday’s prompt change and Wednesday’s reindex the same day. Each vertex paid back its cost that week.
Ten things to monitor in production
A starter checklist for what to put on your dashboard; not exhaustive, but a working baseline.
- Total runs per hour. Traffic patterns. Spikes that don’t correlate with feature launches are interesting.
- Average tokens per run. Trends up and your costs are silently rising.
- p50 and p95 latency per endpoint. User-perceived speed.
- Eval pass rate (rolling 24h). Quality drift in production.
- Per-user cost (top 10 users today). Catches the runaway consumer or the bug.
- Termination reason distribution. What proportion of runs hit
iteration_limitorerror. Both are signals worth investigating. - Tool call frequency by tool. Which tools are getting used; which are dead code.
- Sandbox creates and kills (Chapter 12). Anomalies suggest leaks or runaway sessions.
- Filter blocks per hour (Chapter 11). Attack patterns visible here.
- Deploy diff vs. prior version. Quality and cost compared to the last release.
You don’t need a custom dashboard for any of this. The audit log + a few jq queries cover the questions a single team needs to answer. When you outgrow grep, Langfuse, Datadog, Honeycomb, and Grafana all have the building blocks. Pick the tool you already use; spend an hour wiring the panels.
What to ship in v1
A pragmatic v1 that hits all three floors of the Production Triangle.
- Hono server with
/agentPOST and/healthzGET. - Per-event audit log to disk (
./audit.log), shipped to your existing log aggregator. No SaaS dependency required on day one. - Per-user budget in Redis (free tier on Upstash; check + decrement per run).
- Per-run cost alert when daily total crosses a threshold.
- Eval suite (Chapter 10) gated in CI.
- Rollback procedure documented and tested before the first real user.
- Streaming endpoint for any consumer-facing UX.
- Tool gating in three tiers. Read-only tools (search, retrieve, list) always allow. Destructive or irreversible tools (delete user, send email, run shell on a production host) always deny on this deployment. Anything in between (write to a customer-visible field, charge a card, cancel a subscription) prompts for explicit confirmation. The role gate in
server.tsis the simplest always-deny shape; for a richer policy, move the rules into a YAML file the server loads at startup so changing what’s allowed is a config push, not a deploy.
That’s a real, observable, cost-bounded, deployable v1 in maybe 200 lines of glue on top of everything you’ve built in Chapters 9-14.
Scaling notes: what changes at 10x and 100x
The architecture in this chapter ships fine for the first few thousand users. Some things start to bend at higher scale.
At ~10x (tens of thousands of daily runs). The Hono server is fine. Vercel Functions might start hitting concurrency limits depending on plan; consider switching to Fly or another long-running runtime. Langfuse’s free tier might hit its quota; upgrade or self-host. Per-user budgets need a real Redis instead of in-memory; stick with Upstash if you don’t want to operate one. Eval suite runtime might get long; split into fast-tier (every commit) and thorough-tier (nightly).
At ~100x (hundreds of thousands to millions of daily runs). You’re past the comfort zone of any single managed service tier. Self-hosted Langfuse becomes attractive. The per-user budget store needs to handle high write throughput; Redis is fine, but the data model matters. Sandbox costs become a meaningful line item; consider self-hosting Firecracker. The cost engineering chapter from earlier becomes operationally important; routing to Flash-Lite for cheap tasks and only escalating to Pro when measured saves real money. Durable execution platforms become attractive for long sessions to avoid losing state on instance restarts.
At any scale. The eval suite, the audit log, the structured per-run logs, and the rollback procedure are non-negotiable. They scale with you because they’re cheap; they save you when something goes wrong because they were already there.
The pattern: what you ship in v1 (the floor of the Production Triangle) doesn’t need to change much for 10x growth. Past 10x, you start swapping individual components for higher-scale alternatives, but the architecture’s shape stays the same. That’s the value of getting the floor right before you scale.
Evolving the assistant
The Chapter 14 build is the autonomous shape of everything we’ve assembled. Up to Chapter 13 the running build was a workflow that composes agents (Planner emits a typed plan, Executor iterates the plan deterministically, each step’s sub-agent is its own reason-then-act loop from Chapter 6). Chapter 14 swaps the Planner+Executor for a single autonomous root: an Agent whose tools list contains four other Agents wrapped via asTool (Chapter 6 concept 8). Per Chapter 6’s framing, this is the agent shape: the LLM controls the flow, code provides the tools (and here, the tools happen to be other agents).
This is the agent-as-tool pattern from Chapter 6 (concept 8), instantiated for real. Why now: by this chapter the assistant is good enough that we can hand the wheel to the model. The earlier chapters built the safety + sandbox + memory + observability infrastructure that makes “give the model autonomy” a defensible choice rather than a reckless one.
One thing to flag before the diagram: the scope narrows. Chapter 13’s planner routed everything (research, code, translate, memory edits, chitchat) so it carried six sub-agents. Chapter 14’s deployable shape is a research-and-code orchestrator; Translator, MemoryEditor, and DirectAnswerer drop out because they’re meta-tasks that don’t fit a focused research agent, and each got its teaching beat in earlier chapters. One specialist is new: ContentValidator, the gap-audit role the workflow build never needed because its plan was fixed up front. The autonomous agent-as-tool pattern also works better with a tight, closely-related tool catalogue: fewer tools, all serving one job, make the orchestrator’s loop easier to debug than a sprawling tool surface where the model can pick badly.
The shape, end to end
ResearchOrchestrator (root Agent)
  ├─ tools:
  │   ├─ asTool(researchScout)         ← google_search + http_fetch
  │   ├─ asTool(contentValidator)      ← pure reasoning; structured JSON output
  │   ├─ asTool(codeAuthor)            ← drafts a JS/TS snippet
  │   └─ asVerifierTool(codeVerifier)  ← execute_code (Docker; dev only)
  │                                       + formatVerifyOutcome
  │                                       → { outcome, user_message }
  └─ instruction:
      1. Decompose the user's question into 1-3 subtopics.
      2. Call researchScout for the primary subtopic.
      3. Call contentValidator with {question, findings}.
      4. If validator returns gaps, re-call researchScout with sharper queries.
         Stop after one re-scout per subtopic.
      5. If the question warrants a code example: call codeAuthor, then codeVerifier.
         If envelope.outcome="error", ask codeAuthor to fix it once.
         If envelope.outcome="denied", note in the brief that code couldn't run.
         If envelope.outcome="executed", quote the relevant lines as evidence.
      6. Compose the brief: ~250 words, citations inline, code in a fenced block,
         end with "Confidence: high/medium/low".
Each specialist is a normal Agent. asTool(name, description, agent, inputDescription) (Chapter 6’s two-argument helper, widened here with an explicit tool name and input description; still under 20 lines) wraps an agent as a FunctionTool the orchestrator can call: the orchestrator’s LLM picks which to call per turn and reads the response.
codeVerifier gets a specialised wrapper, asVerifierTool, that inherits the same shape but bolts on the structured-envelope pattern from Chapters 11-12. The flow: the inner codeVerifier agent calls execute_code (its closure-bound tool factory exposes the raw last result via lastResult()); asVerifierTool then runs formatVerifyOutcome({agentReply, toolResult}), a small gemini-3.5-flash call constrained by a Zod schema, and returns a typed envelope { outcome: "executed" | "denied" | "error", user_message: string } to the orchestrator. The orchestrator’s LLM reads outcome as a structured enum value; both the role-gate decision (outcome="denied" short-circuits the retry path) and the author-retry decision (outcome="error" triggers one re-author) dispatch on that enum directly.
There’s no fixed sequence and no separate planner; the orchestrator’s own loop does the deciding. Its instruction encodes the conditional flow (the if-gaps-then-re-scout, the if-outcome-error-then-fix-once); the Chapter 6 Agent.run() loop iterates the orchestrator’s LLM and dispatches its tool calls. A request that doesn’t need code only fires the first three specialists. A request that fails validation gets re-scouted. A request the model can answer from its own knowledge might not even fire researchScout. The model decides per turn.
Run it
Two terminals:
cd code/chapter-14/
npm install
npm run build:sandbox          # one-time, builds ch14-sandbox:latest

# Terminal 1: the production server
npm run dev                    # listens on :3000

# Terminal 2: hit it
curl -X POST http://localhost:3000/agent \
  -H "Content-Type: application/json" \
  -d '{"role":"dev","userId":"hiro","question":"What is BM25 and how does the k1 saturation parameter behave? Show me a short example."}'

# Streaming variant
curl -N -X POST http://localhost:3000/agent/stream \
  -H "Content-Type: application/json" \
  -d '{"role":"dev","userId":"alice","question":"why does 0.1 + 0.2 not equal 0.3 in JavaScript?"}'
A real run, from a clean db, on the BM25 question:
[08:05:52] request: role=dev user=hiro
[08:05:52] q: What is BM25 and how does the k1 saturation parameter behave? Show me a short example.
[08:05:54] memory: profile=(unnamed), 0 prefs, 0 focus, 0 prior recall
[08:05:54] orchestrator: starting (autonomous; agent-as-tool)
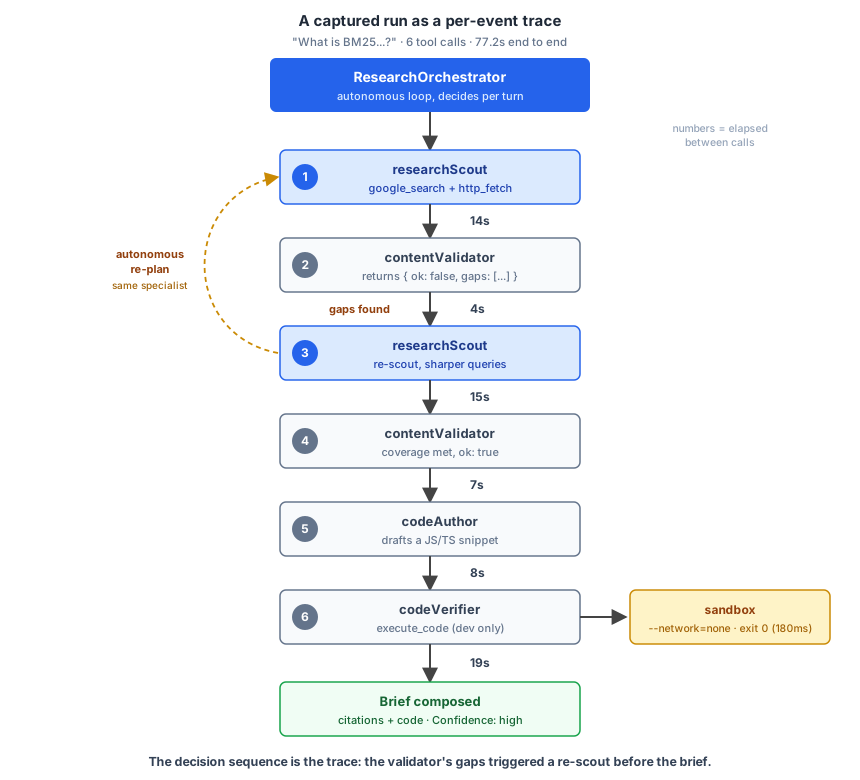
[08:05:55]   -> researchScout (call #1)
[08:06:09]   -> contentValidator (call #2)
[08:06:13]   -> researchScout (call #3)
[08:06:28]   -> contentValidator (call #4)
[08:06:35]   -> codeAuthor (call #5)
[08:06:43]   -> codeVerifier (call #6)
[08:06:46]   [sandbox] docker run ch14-sandbox:latest (js, 1364B snippet, --network=none)
[08:06:46]   [sandbox] exit=0 (180ms, stdout=1036B, stderr=0B)
[08:07:02] orchestrator: done (6 tool calls; researchScout=2, contentValidator=2, codeAuthor=1, codeVerifier=1)
[08:07:02] post: output filter scanning 3307 chars...
[08:07:07] post: output filter done in 5.2s (0 redaction(s))
[08:07:07] post: recording interaction (embedding + sqlite write)...
[08:07:07] post: interaction recorded in 514ms
[08:07:07] post: extracting profile updates from exchange...
[08:07:10] post: profile extraction done in 2.3s
[08:07:10] done in 77.2s
The orchestrator scouted, the validator flagged a coverage gap, so the orchestrator re-scouted with a sharper query (call #3) and re-validated before moving on. It then authored a snippet and verified it: the sandbox ran the authored code (exit 0 in 180ms). The output filter found nothing to redact on this run. The brief landed: a BM25 explanation with citations, a working JavaScript snippet showing k1 saturation, ending with Confidence: high. Six tool calls, roughly 68 seconds inside the orchestrator’s loop, 77 seconds end to end.
One more thing to check in the audit log: a single verify_envelope event with outcome=executed. That’s the structured-envelope formatter classifying the run, and it’s what the orchestrator’s LLM dispatched on when it decided whether to retry codeAuthor. Run the same prompt with role=user and the audit log shows tool_call_denied followed by verify_envelope outcome=denied; the orchestrator continues composing and the final brief explicitly says “execution was restricted by system permissions”.
That re-scout on call #3 is the autonomous re-planning the agent-as-tool pattern enables: contentValidator returned {ok: false, gaps: [...]}, and the orchestrator re-invoked researchScout with sharper queries before composing. It’s what distinguishes this build from the Chapter 13 Plan-and-Execute, which can’t change its mind mid-execution. Neither shape is more advanced than the other: the workflow wins on predictable cost and debuggability when the task always decomposes the same way, and the agent wins on flexibility when the right shape varies per question. The Chapter 13 build is still in code/chapter-13/ if you want to compare them on the same prompts.
Deploy it. Be honest about what this build wants: exactly what your laptop has. Node, a Docker daemon (for the sandbox), and a disk that sticks around (for memory.sqlite and audit.log). The production match for that is a VM you control: a Fly machine, an EC2 instance, a $6 droplet. Install Node and Docker, clone the repo, npm run build:sandbox, then run the server under a process manager:
npm run build:sandbox
node --env-file=.env --strip-types server.ts   # systemd or pm2 in real life
That’s the autonomous agent in production. You’ve shipped it. What you can’t do is vercel deploy this as-is: serverless platforms (and most container platforms’ default runtimes) give you no Docker daemon to spawn and no filesystem that survives between invocations. Getting onto one of those means real surgery first: swap runInDocker for a managed sandbox API (E2B, Vercel Sandbox), move memory to a hosted Postgres or Redis, and ship the audit log to a log drain. That surgery pays off at scale, and a VM will carry you a long way before you need it. One note on the budget before you harden it: the server counts requests rather than tokens, because an autonomous orchestrator makes a variable number of model and tool calls per request. For token-accurate budgeting, sum the usageMetadata.totalTokenCount field the SDK returns on each generateContent response (the Chapter 6 runtime already shows the pattern), write the per-call counts to the audit log, and sum per user.
Action
Before you call this done:
- Set up
code/chapter-14/. Install deps (@google/genai,hono,@hono/node-server,better-sqlite3,zod). Build the sandbox image withnpm run build:sandbox. - Start the production server (
npm run dev). Hit/agentwith curl on the BM25 question (or any of your own). Confirm the response includes the budget and the brief actually includes a working code snippet. - Read
./audit.logafter the run withjq. Filter fororchestrator_tool_callevents to see exactly which specialists the orchestrator picked and in what order. Pick a question that should need ContentValidator’s gap-filling and confirm the orchestrator re-invokes ResearchScout in the trace. - Hit
/agentwith the sameuserId101 times to exceed the daily request budget of 100. Verify the 101st request returns429with{"error": "daily request budget exceeded"}. - Hit
/agent/streamwith curl-N. Watch thestartevent, thepingheartbeats every 5 seconds, and the finalanswer+doneevents. - Deploy to a VM with Node and Docker installed (Fly machine, EC2, a droplet): clone,
npm run build:sandbox, runserver.tsunder systemd or pm2. If you’d rather target a serverless platform, do the surgery first: swap the Docker-backedexecute_codefor a managed sandbox API, movememory.sqliteto a hosted store, ship the audit log to a drain, and switch the in-memory budget to Upstash Redis (or any KV store with per-user TTLs) before any real users. - Run your eval suite (Chapter 10) against the production URL.
- Document your rollback procedure. Test it before you need it.
Why most agents in production aren’t working
The Production Triangle gets the engineering right. It doesn’t tell you whether the agent is worth running, and the survey data on that question is uncomfortable.
MIT NANDA’s GenAI Divide: State of AI in Business 2025 (July 2025) found that 95% of generative AI pilots delivered no measurable P&L impact, with only 5% of integrated systems creating significant value. McKinsey’s State of AI global survey reports the same split from the other side: 88% of organisations now use AI in at least one function, but only 39% report any EBIT impact at the enterprise level, only 7% have AI fully scaled, and just 6% qualify as high performers with 5% or more of EBIT attributable to AI.
BCG’s October 2024 survey of 1,000 CxOs across 20+ sectors found just 4% had built leading AI capabilities; the September 2025 follow-up (1,250 respondents) put value-creators at 5% and the no-material-value group at 60%. RAND’s Why AI Projects Fail put failure above 80%, roughly twice the rate of non-AI IT projects.
Different methodologies, different samples, same shape: adoption is close to universal and measured value sits in the single digits.
One category is the exception, and it’s the one you work in. GitHub’s controlled study measured Copilot users 55% faster on a “build an HTTP server in JavaScript” task (1h11m against 2h41m, p=0.0017). Anthropic’s November 2025 study of 100,000 Claude conversations estimated AI cuts individual task time by about 80%. Sundar Pichai said at Cloud Next 2026 that 75% of new code at Google is AI-generated and engineer-approved, up from roughly 25% in October 2024 and 50% in October 2025.
The likely reason is verification. Compilers, tests, and code review close the loop in seconds, so a wrong answer is caught cheaply and early. Most business functions have no equivalent check.
Whatever you ship also has to survive the platform moving underneath it. Anthropic retired twelve Claude models in the twelve months to October 2025, and the April 2026 Claude Code incident saw five-hour Max session windows depleting in as little as 19 minutes. Observability is how you notice that, cost controls are how you bound it, and deploy discipline is how you swap the model without the workload dying. That’s what this chapter has been building.
Next up, the bonus chapters: six branches off the same assistant. Two cover RAG, from fundamentals to the production-shape retrieval funnel. Two rebuild this chapter’s autonomous agent on a framework (Google’s ADK, then eve, Vercel’s durable-agent framework), so you can see what an off-the-shelf runtime replaces. One ports the runtime’s fetch_url to a Model Context Protocol server, so any MCP host (Claude Desktop, Claude Code, Cursor, or our own runtime) can call it. And one covers WebMCP, the browser-native variant of the same idea. The patterns stay the same throughout.